What’s Inside?
- What is Dynamic Support and Resistance?
- How I can find Dynamic Support and Resistance in the forex market?
- What is the Ichimoku Cloud?
In my last article, I talked about how forex traders can find the best key support and resistance levels. This is a critical component to understanding price action trading. But what is less talked about, yet critical for your trading is understanding and finding Dynamic Support and Resistance.
In this article, I’m going to help you understand what is the difference between ‘static‘ and ‘dynamic‘ support and resistance. From here I’m going to talk about why you need to understand dynamic support and resistance, along with give you two methods for identifying and trading dynamic support and resistance.

What is the difference between static and dynamic support and resistance?
When we talked about key support and resistance levels in our last article, you should have noticed a pattern. You should have noticed all those levels were ‘horizontal‘. While many key support and resistance levels are horizontal, many of them are ‘evolving‘, which means they are ‘dynamic‘. Dynamic support and resistance levels, or areas, where the market can pull back into and find support w/o needing to be at a horizontal support or resistance level.
This happens because:
1) The market is evolving, and sometimes buying/selling interest changes in a way that isn’t at pre-designed levels
2) Momentum in trends is dynamic, along with the order flow
Momentum can often be the underlying energy behind trends or movements (kind of like running downhill).
There are other reasons, but the key point is that you get the underlying idea, and can integrate this ‘conceptual knowledge‘ into your trading. We’ll get to this later in the article.
But to summarize:
a) Static support or resistance levels aren’t moving, and are horizontal in nature
b) Dynamic support or resistance levels are moving, and are not horizontal in nature
Now that we know what dynamic support and resistance is, we can move onto the next section.
How I can find dynamic support and resistance in the forex market (or any market for that matter)?

There are many methods to find dynamic s/r, but we’ll talk about two that I prefer to use.
Dynamic Support and Resistance Strategy #1: The 20 EMA
The 20 EMA is one of my favorite choices for discovering dynamic support and resistance as it does a really good job of being ‘balanced‘. What do I mean by being ‘balanced’? So the 20 EMA (exponential moving average) tracks the last closing prices of the candles for the last 20 periods. It gives more weight to the most recent closes (hence why it’s exponential), with less as you go through the series of 20 candles.
Below is a good graphic of how it differs from a ‘simple’ moving average which weighs the data the same regardless of time.
EMA’s (exponential moving averages) are balanced (IMO) because it does a great job of detecting the more recent momentum and changes in the price action, while at the same time taking into account some of the longer term movements in the price action, so well placed in between those two forces (hence ‘balanced’).
Below is a 1hr chart on the EURUSD showing the 20 EMA and how the price action related to it.
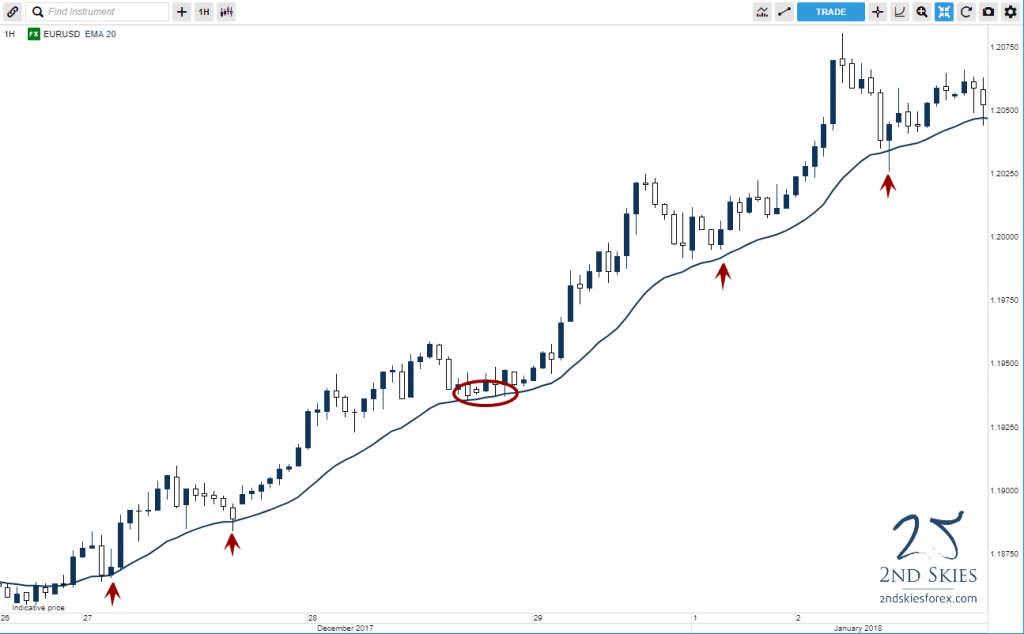
Notice how the price action touched the 20 EMA several times (navy line) which could have offered you great trade setups to get into the market with trend?
Another example is below on the S&P 500 on the 4hr chart.
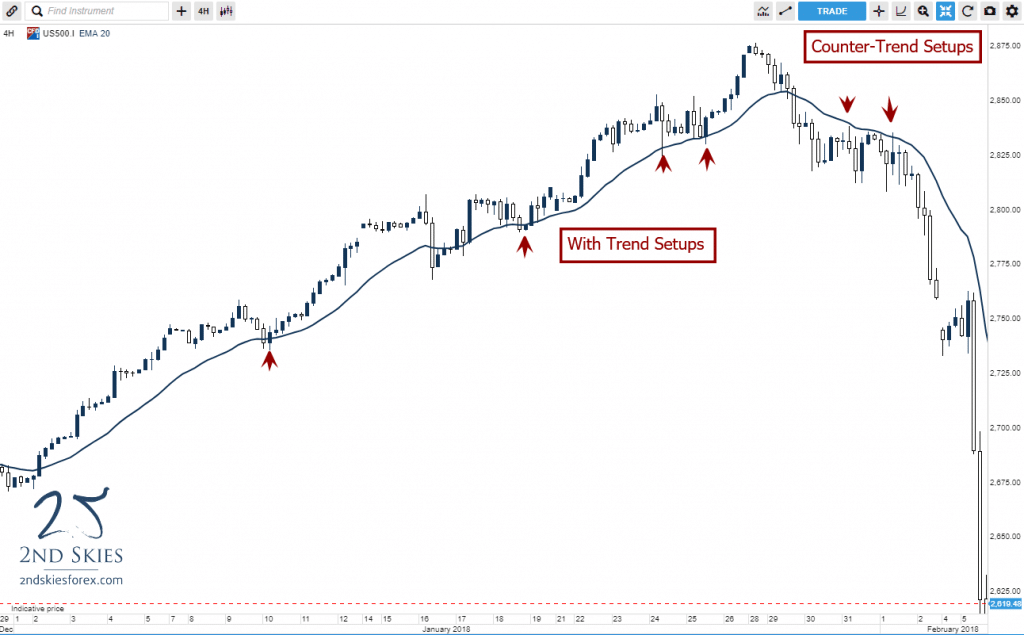
In this chart of the S&P 500, you can see how the 20 EMA offered some great trade setups both with trend, and counter-trend as the market reversed.
It’s important to note the 20 EMA can act as a solid method for finding dynamic support and resistance on any time frame.
Dynamic Support and Resistance Method #2: The Ichimoku Cloud
In the first 3 years of my trading, I spent the majority of my time learning, studying and trading two strategies:
#1 price action
#2 the ichimoku cloud
If you want to learn about how I trade price action, click here to watch
However for now I’d like to talk about the ichimoku cloud (called ‘ichimoku kinko hyo’) roughly translates from japanese to ‘one glance balanced chart‘. It was created by Goichi Hosada many decades ago. It is one of the most commonly used methods for analysis and trading strategies in Japan, and there are many great ichimoku traders who were considered some of the best analysts of their time (i.e. Hidenobu Sasaki).
To briefly sum up the ichimoku cloud, the goal of this approch is to communicate in one shot (or ‘glance’) the following:
1) what is the trend in the market
2) what is the underlying momentum (or lack thereof)
3) what are future key support and resistance levels
You read that last part right (“future”). One of the primary goals of the ichimoku cloud is to give you an idea where future support and resistance levels will be (and how much there is).
I’m not going to do a whole lesson on the ichimoku cloud. If you want to learn more about the ichimoku cloud and how it’s constructed, click here.
But for our purposes, just understand that the ichimoku cloud measures a) momentum {a form of dynamic support or resistance}, and b) future support and resistance levels.
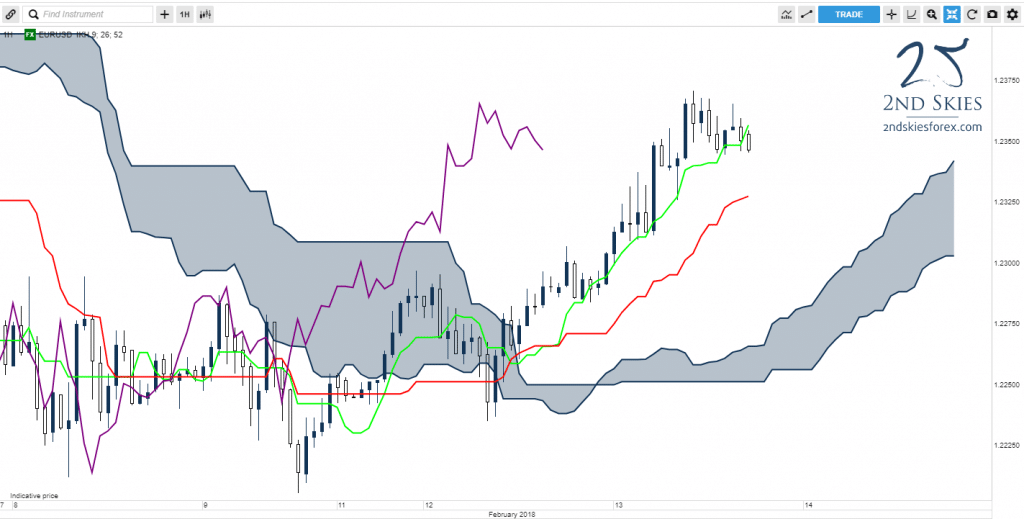
Below is a chart to show you how this works.
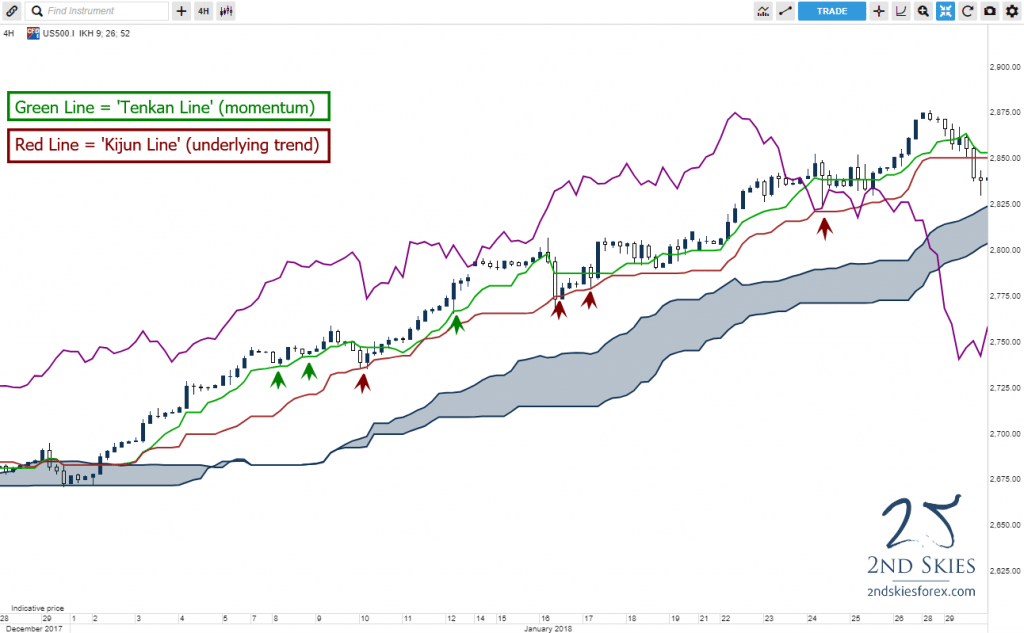
In the above S&P 500 ichimoku cloud chart on the 4hr time frame. There are several ways the ichimoku kinko hyo can act as ‘dynamic’ support or resistance. But for our purposes, in this uptrend, notice how the Tenkan Line (green line) did a good job acting as support on minor pullbacks.
The tenkan line does this well because it’s meant to track the underlying momentum in the price action. If the trend is strong, and has good momentum, the tenkan can often act as support or resistance. If momentum is weak, you’ll see this in the tenkan line by price crossing it more frequently, and not respecting it. This should tell you momentum is ‘weak’ or ‘weakening’ (depending upon the ichimoku context).
You’ll also notice the kijun line (red line) which is supposed to track the underlying trend in the price action. Notice how as price pulled back deeper in the uptrend, it stopped at the kijun several times, offering potential trade setups to get in this with trend.
There are many ways ichimoku is great for helping you find ‘dynamic’ support or resistance, but these are two good methods for now.
NOTE: If you want to learn more about the ichimoku cloud, click here for several free videos on learning more about the ichimoku cloud.
In Summary

While we spent a good amount of time recently talking about horizontal key support and resistance levels, today we’ve showed you how there is a different form of support and resistance which expresses itself as ‘dynamic‘.
We’ve also given you methods for finding dynamic support and resistance, along with showing you how the ichimoku cloud can provide an alternative (and useful) trading method.
Now one thing I forgot to ask is, have you ever looked at a chart and had a hard time finding key support and resistance levels?
Usually when I look at the price action on a chart, and I find it’s pulling back to areas where there doesn’t appear to be any support or resistance, I often try to see if the market is respecting ‘dynamic’ levels vs horizontal ones. Often times when I do this, the chart becomes more clear as this change in perspective gives me new trading opportunities I was missing before.
If you’d like to learn more about the ichimoku cloud, don’t forget to check out my ichimoku trading course. And if you want to learn more about forex dynamic support and resistance, take a look at my price action course.
Now Your Turn
Have you had this experience of not being able to find key dynamic or static support and resistance levels, or why the market pulled back to where it did? What did you learn about forex dynamic support and resistance levels from this article?
Make sure to leave your comments below, along with ask any questions you have on the subject. And don’t forget to tweet/like this article on your favorite social media so others can benefit from it.
Until then, I’ll look forward to hearing from you.

I use 3sma System 30Sma – 50 Sma and 100 SMA Crossover below 100 SMA trend is Over buy on dinamic area 30-50. Does not work all the time 60%-70% accurracy
What is the best solution 3sma System or ichimoku cloud in your opinion ?
It’s there any adaptive 3SMA because with this values on 3sma it’s posibile to lose some trends (not harmonically waves)?
Hello WS,
I can’t really speak to your system based on this limited information, so not much to really comment on there.
What I can comment on is how the ichimoku cloud is unique and can offer you trading opportunities that most systems will miss.
If you have any questions, do not hesitate to email me directly.
Another GREAT article, Chris! Keep them coming! Your courses have been the greatest investments for me so far, in terms of trading.
Hello Peter,
Good to hear from you. Yes, I’ll keep em coming. Am glad you’re finding our trading courses great investments.
Kind Regards,
Chris
Looking forward to being another one of your success stories! It’s a lot of work but I’m loving the daily grind.
Looking forward to you being the next one as well.
i have been one year trading price action there is no profitable. but today Mr.chris changed everything my trading rule. every single trade i take i get profit now. thanks mr chris.
Hello Shakoor,
Nice, I’m glad to hear you’re seeing significant change in your trading performance.
Kind Regards,
Chris