Introduction to the Ichimoku Cloud
The Ichimoku cloud is one of the more unique trading methodologies out there. Originally developed in the 60’s in Japan by Goichi Hosada, the Ichimoku cloud (also known as Ichimoku Kinko Hyo – or ‘one glance balanced cloud chart) was first published in a series of 4 books and over 1000 pages.
After releasing the Ichimoku cloud, Goichi Hosada started to go by the pen name Ichimoku Sanjin. Originally build for the Japanese stock markets, the Ichimoku cloud indicator eventually made its way into the western trading world via the stock, commodities and forex markets.
As the name implies, the goal of the Ichimoku cloud is to give you a complete idea of the market at one glance. In other words, the Ichimoku cloud is designed to give you information about the trend, momentum, price action, key support and resistance levels, along with potential turning points and likely future direction.
In this article, we’re going to cover the core components of the Ichimoku cloud, which include the 5 lines and the 3 pillars.
The 5 Lines of Ichimoku
The Ichimoku cloud indicator. This is what Ichimoku is most famously known for is the 5 lines that are unique to Ichimoku.
The following are the 5 lines of the Ichimoku cloud:
- The Tenkan-sen (sen means ‘line’ in Japanese)
- The Kijun-sen
- The Chikou Span
- The Kumo (or cloud, which is composed of the Senkou Span A & B)
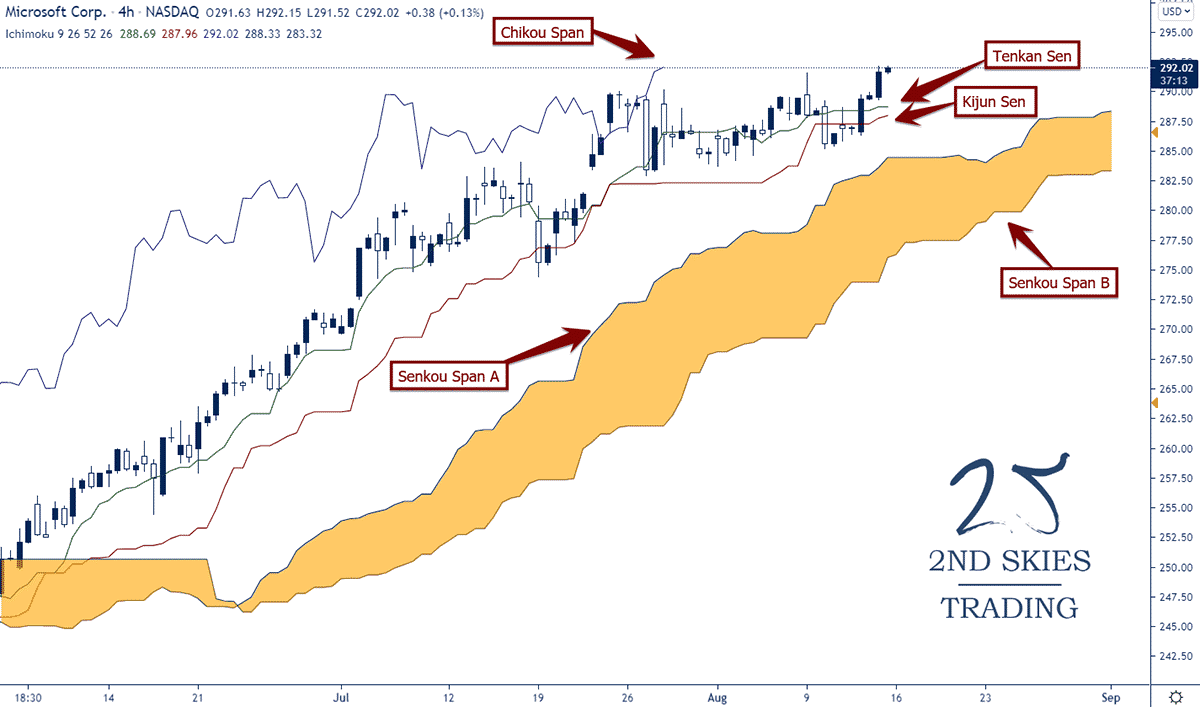
The 5 lines above comprise the most visible aspects of Ichimoku and convey a lot of information about a stock’s price action so lets break down each of the 5 lines and what they communicate for the stock investor or trader.
The Tenkan-sen
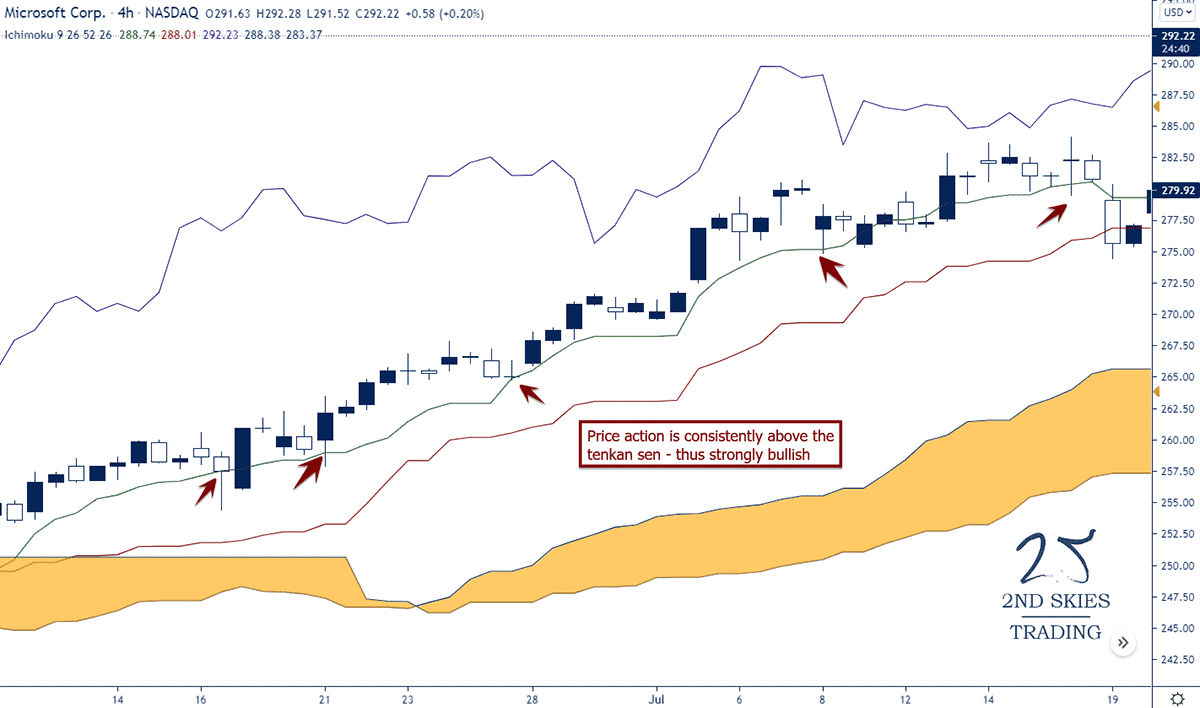
The Tenkan-sen which you can see in the above chart is similar to a 9 EMA (exponential moving average), and thus acts like dynamic support or resistance, but uses a slightly different calculation.
The Tenkan-sen is calculated by taking the highest high + the lowest low over the last 9 periods (or candles) and create a line to describe those 9 periods of price action.
The best way to think about the Tenkan-sen is as a line the calculates momentum and volatility. It incorporates a short to medium term momentum (by covering the last 9 periods) while also including volatility which will be partially represented by the highest highs and lowest lows over that 9 period.
Generally, when the Tenkan-sen is trending up and the price action is above the Tenkan-sen, the market is considered to be strongly bullish for uptrends.
For downtrends, if the price action is below the Tenkan-sen while it’s trending down, then the market is strongly bearish.
The Kijun Sen
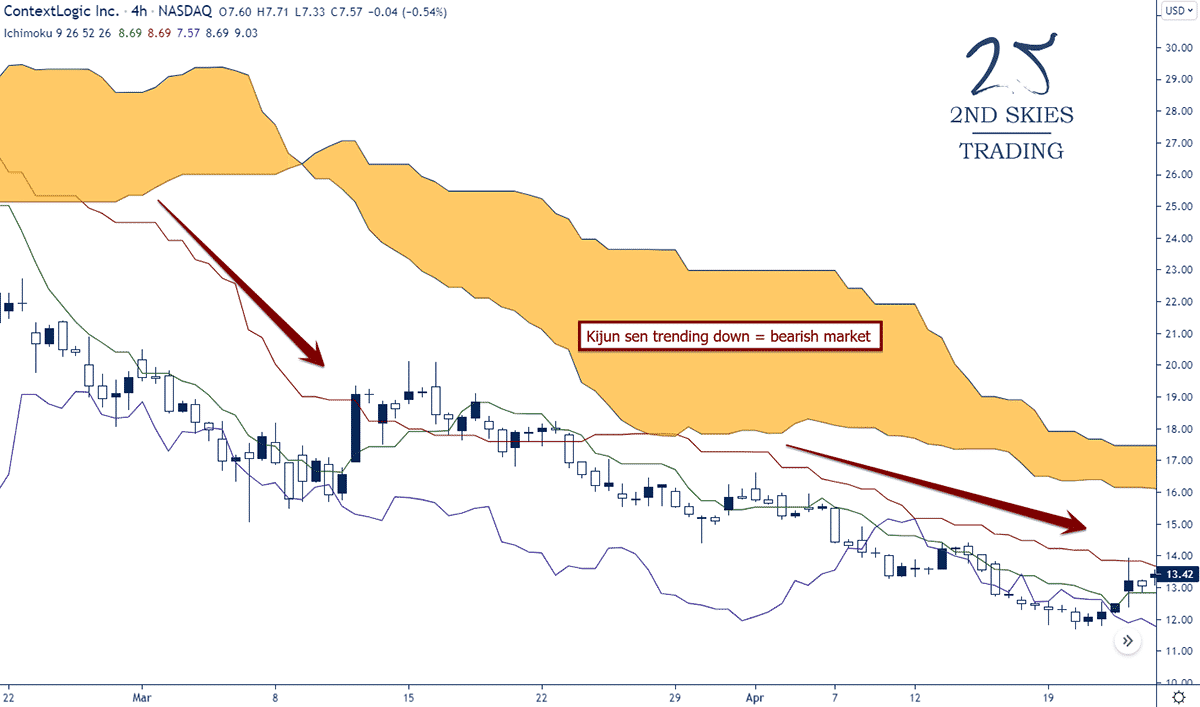
The Kijun-sen is often referred to as the datum line or trend line, meaning its function is to gauge the overall trend of the stock or instrument.
Generally speaking, when the Kijun-sen is trending up and the price action is above, the market is in a bull trend, and if its trending down while the price action is below it, the market is in a bear trend.
The Kijun-sen covers the highest high + the lowest low over the last 26 periods, so essentially the same calculation as the Tenkan-sen, but over a longer period, thus capturing the overall trend, but not as sensitive to shorter term bursts of volatility and momentum.
The Chikou Span
The Chikou span is a lagging line which takes the current closing price and shifts it back 26 periods (or candles) of time.
Why would the Chikou span be shifted back 26 periods?
The idea is to take the current closing price and compare it to the prior price action to see if there is resistance ahead in a bull trend or support lower in a bear trend.
If the Chikou span is above the prior price action, there is little history or resistance in the way of the current trend (for a bull trend, and vice versa for a bear trend).
In the chart below, we can see the Chikou span (purple line) has no price action or structures above it, thus no historical resistance in the way here.

The Kumo (or cloud)
The most unique aspects of the Ichimoku cloud is the Kumo (cloud) part of the indicator.
If you notice in the stock chart below, the cloud is below and ahead of the current price action. This is because the Span A (upper part of the cloud in an upward rising cloud) which is formed by taking the Tenkan-sen and adding it to the Kijun-sen, dividing that value by 2, then plotting it 26 periods ahead. So:
(Tenkan Line + Kijun Line) / 2 placed 26 periods ahead
Span B is formed by taking the highest high (over the last 52 periods) and adding it to the lowest low (over last 52 periods), dividing that by 2 and plotting it 26 periods ahead. Thus:
(Highest High + Lowest Low over last 52 periods) / 2 and plotted 26 periods ahead.
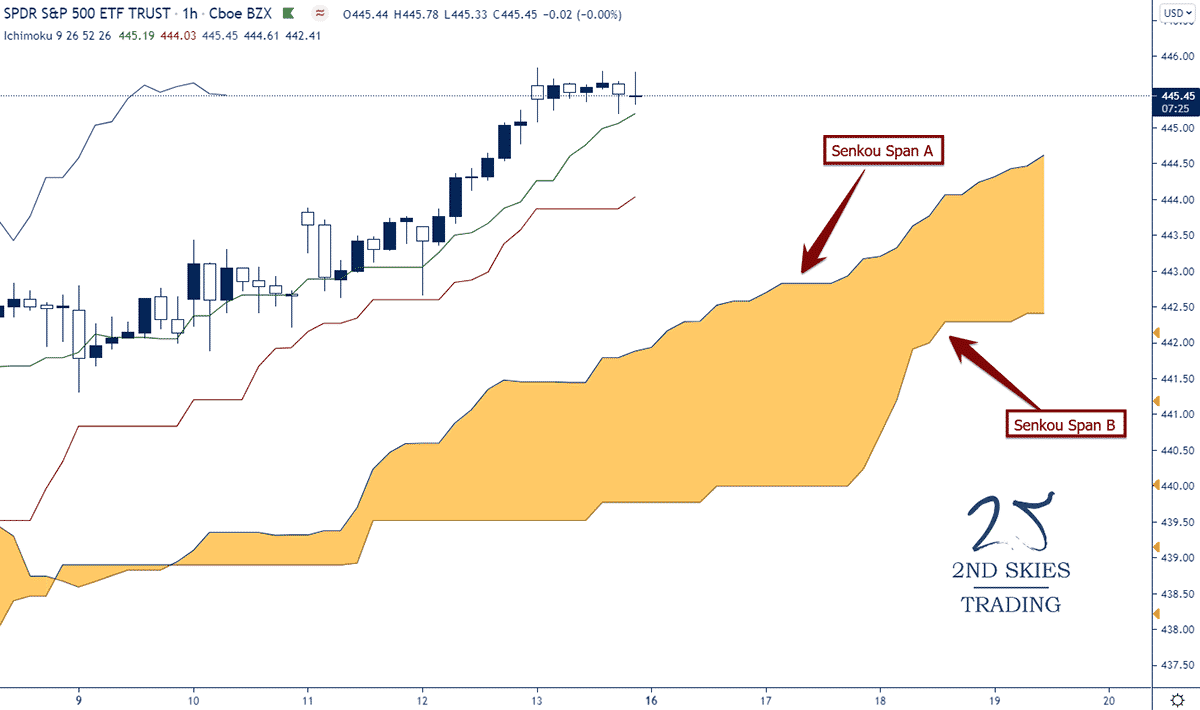
The main goal of the Kumo is to give the stock investor or trader an idea of future support and resistance.
In a general way of speaking, if the price action is above the Kumo while its rising, you are in a bull trend. If the price action is below the Kumo while its falling, you are in a bear trend.
You will notice across many stock charts (especially higher time frames like the 4hr, daily and weekly charts) that strong bull trends will stay above the Kumo for long periods of time. They will also sometimes pull back to the Kumo, treat it as support, then continue in the bull trend.
This can sometimes be used for potential adding points for stock investors to add to their current stock holdings, or for swing traders looking for potential pullback locations to get long.
5 Lines Closing Comments
The 5 lines of Ichimoku have both individual functions and are meant to provide a collective picture (or one glance) of the stocks current trend (Kijun), momentum (Tenkan), along with potential future support or resistance levels (Kumo).
While there are more subtle nuances involved, this covers the basics of the Ichimoku cloud and its 5 lines.
There are more advanced aspects of the Ichimoku cloud called the 3 Ichimoku pillars. For those of you looking to learn more advanced aspects of the Ichimoku cloud, read on.
The 3 Pillars of Ichimoku
While most people associate Ichimoku with its 5 lines, the real base of Ichimoku theory is the 3 pillars. The following are the 3 pillars which all of Ichimoku is based upon:
- Ichimoku number theory
- Ichimoku wave theory
- Ichimoku time theory
Ichimoku number theory is based upon 4.5 years of research by Goichi Hosada who studied every Easter and Western theory under the sun, including physics, Fibonacci’s, and various eastern numerological systems.
Eventually he settled upon 3 numbers that became the basis of all Ichimoku numbers. They were 9, 17 and 26. There are technically 10 numbers in all, but these are the primary ones.
The numbers according to the original texts are referred to as one section (9), two sections (17) and 1 period (26).
While I’d like to dive in deeper at some future point into Ichimoku number theory, after speaking with Hosada’s grandson (see picture below) who has studied Goichi Hosada’s texts extensively, he agreed with me the most important of the 3 pillars is the one I’m going to talk about next.

Hence, while you’re welcome to spend time studying Ichimoku number theory, I don’t think it has many practical applications for the everyday trader.
The second pillar of the Ichimoku cloud is Ichimoku wave theory, and this pillar (IMO) has lots of applications for every kind of trader. In Ichimoku wave theory, there are 3 main types of waves, which are simply price action structures that give you more probable directions for the next move. The three waves are I waves (1 leg), V waves (2 legs) and N waves (3 legs).
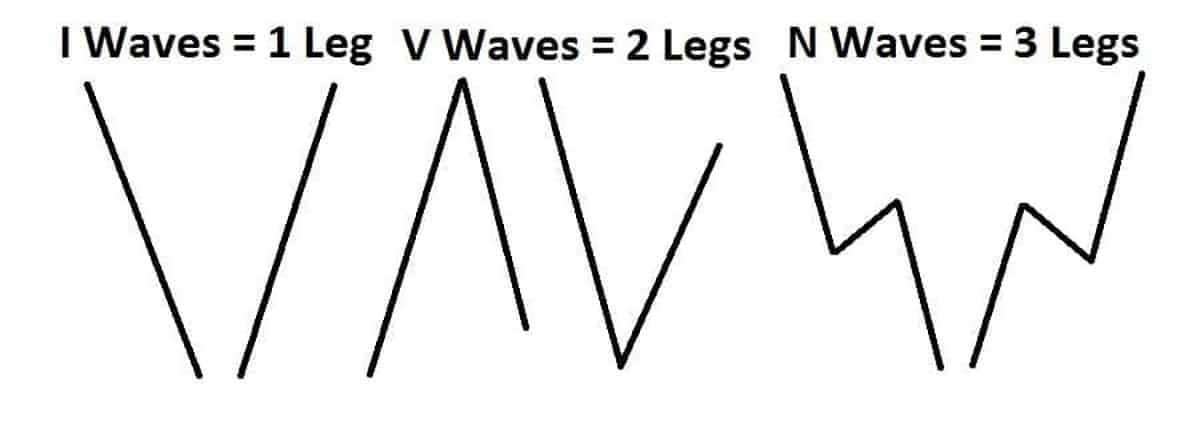
As you can see, any of the 3 types of core waves can be upward or downward in direction. For those of you familiar with my core models of understanding price action and order flow, you’ll see the I waves are impulsive moves, V waves are two impulsive moves in opposite directions, and N waves are impulsive moves, followed by a corrective move, then continuing with another impulsive move in the same direction.
I waves (or impulsive moves) signal a dominant imbalance in the order flow to one side of the market. When there is an imbalance in the order flow to the buy or sell side, the market moves directionally. The stronger the imbalance, the stronger the directional move.
Between the 3 waves, the N wave and V wave are most telling (IMO). Why? Because a V wave is an impulsive move followed by a counter directional impulsive move. This suggests a strong amount of buying (or selling) was met with a counter force of buying (or selling) and thus a strong rejection at the top (or bottom of the V wave).
The N wave on the other hand shows a dominant I wave, followed by a weak pullback (i.e. corrective) followed again with a trend continuation of the first impulsive move. This suggests the direction will continue until you see a disruption in this wave structure, minimally via a counter trend I wave (impulsive move).
There are more complex wave structures such as P waves and Y waves, which are simply expanding and contracting volatility waves, but the core aspects of wave structure are in these 3 waves above.
The third pillar of Ichimoku is Ichimoku price theory. The main goal of Ichimoku price theory is to give ‘potential’ future targets for specific moves based upon their price action structure and depth of move. All the price calculations are essentially various types of N waves with varying degrees of pullbacks and retracements before the next likely leg will continue.
The three main price calculations are:
- The V calculation = B + (B – C)
- The N calculation = C + (B – A)
- The E calculation = B + (B – A)
The formulas listed above have corresponding structures and graphs you can see below.
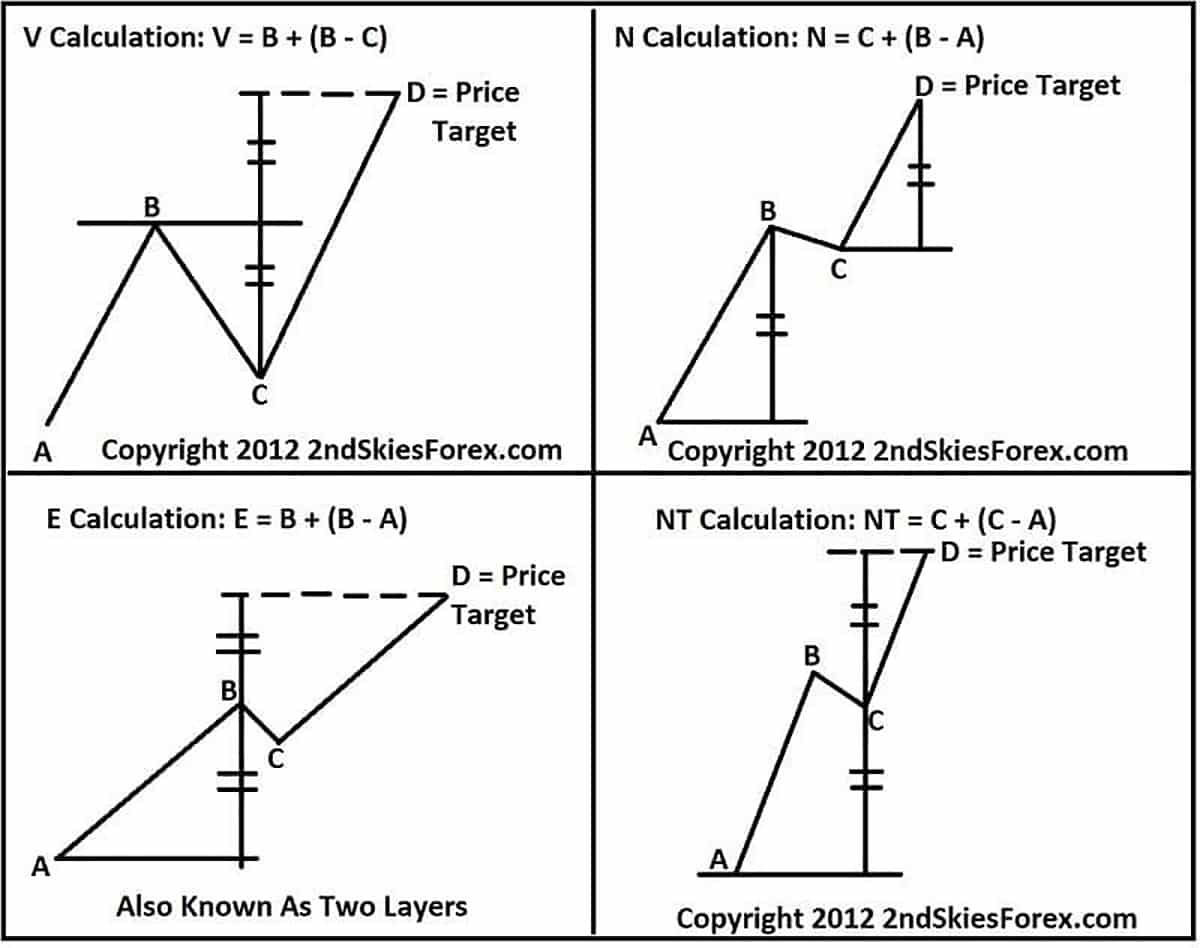
All the calculations above have 4 legs in the move (A, B, C and D). Ichimoku price theory suggests that based upon the calculation and type of move, D will likely be the target for the move from C.
As you can see from all 3 types (NT calculation is a more nuanced one we don’t really cover), they are all various forms of N waves.
The V calculation has the deepest pullback (C), the N calculation has the least or most shallow (corrective) pullback while the E calculation has a mild pullback, but deeper than the N calculation.
The best way to use these calculations is to find which one most aptly describes the current 3-legged structure you are in, and when you see price bouncing from the C point, use your specific calculation to project a potential target for the next move up.
Our suggestion is to back test this over 100’s of charts across various time frames and see how it works.
Those are the three main Ichimoku pillars, however very few Ichimoku traders fully understand them, partially due to the original texts being in Japanese and have not been translated into English.
NOTE: We have possession of the original texts and got them directly from Goichi Hosada’s grandson while we were in Japan in 2020.
In Closing
For long term stock investors or swing traders, the Ichimoku cloud can be a valuable technical analysis tool to help you decide potential adding points, swing entries, determine the overall trend, momentum and potential future support and resistance levels.
When you learn to use the 5 lines sufficiently, the long term stock investor or swing trader should be able to use them effectively for understanding what kind of trend you are in, when the market may be turning, and where are potential locations to get into the market at a solid price.
For those of you wanting to dive deeper into the more intermediate and advanced strategies of the Ichimoku cloud, check out our premium advanced Ichimoku course.