What’s Inside?
- How to find key support and resistance levels in any market
- How can I trade support and resistance zones, either using end of day price action or intraday strategies?
- Why is it hard to find good support and resistance levels to trade?
If there is a subject which repeats itself amongst traders who are struggling with price action, understanding and trading key support and resistance levels would be near the top of the list.
Common questions struggling traders ask are:
- How do I know if a support or resistance level will hold?
- If I have a full time job, and am trading end of day (or daily/4hr time frames), how do I choose the best support and resistance levels?
- How can I find the best support and resistance levels for trading?
Have you asked any (or all) of the above questions when learning trading online? Felt confused about understanding key support and resistance levels? If so, then pay attention to this article as we’re going to put many pieces of this puzzle together regarding key support and resistance levels, along with how to trade them.

Key Point #1: How Professional Traders Relate to Support and Resistance Levels
Anyone who has seen how professional traders trade know they often place their orders ahead of time and less often do market orders. A general theme that shows up is about 70+% of all institutional orders are placed at prices ahead of time, while <30% are market orders.
Now every institution and trader has their own approach. Some use price action, some use the ichimoku cloud, some use fibonacci levels, some use indicators, etc. Regardless, none of that matters.
What does matter is all of them are paying attention to key support and resistance zones. These ‘zones‘ are where they most often place their orders. Now it’s important to understand that each trader and institution has their own ‘holding time‘, meaning how long they like to hold their positions.
Traders who have shorter holding periods will often require a smaller stop. Hence they will want to get as close to the support/resistance level as possible to create the smallest stop available while maximizing their upside. Traders with longer holding times won’t require as much precision and will likely have a larger stop loss to avoid getting kicked out of minor swings to capture the underlying trend.
Now to give you a visual of how this works, lets look at the chart below on the USDJPY weekly chart.
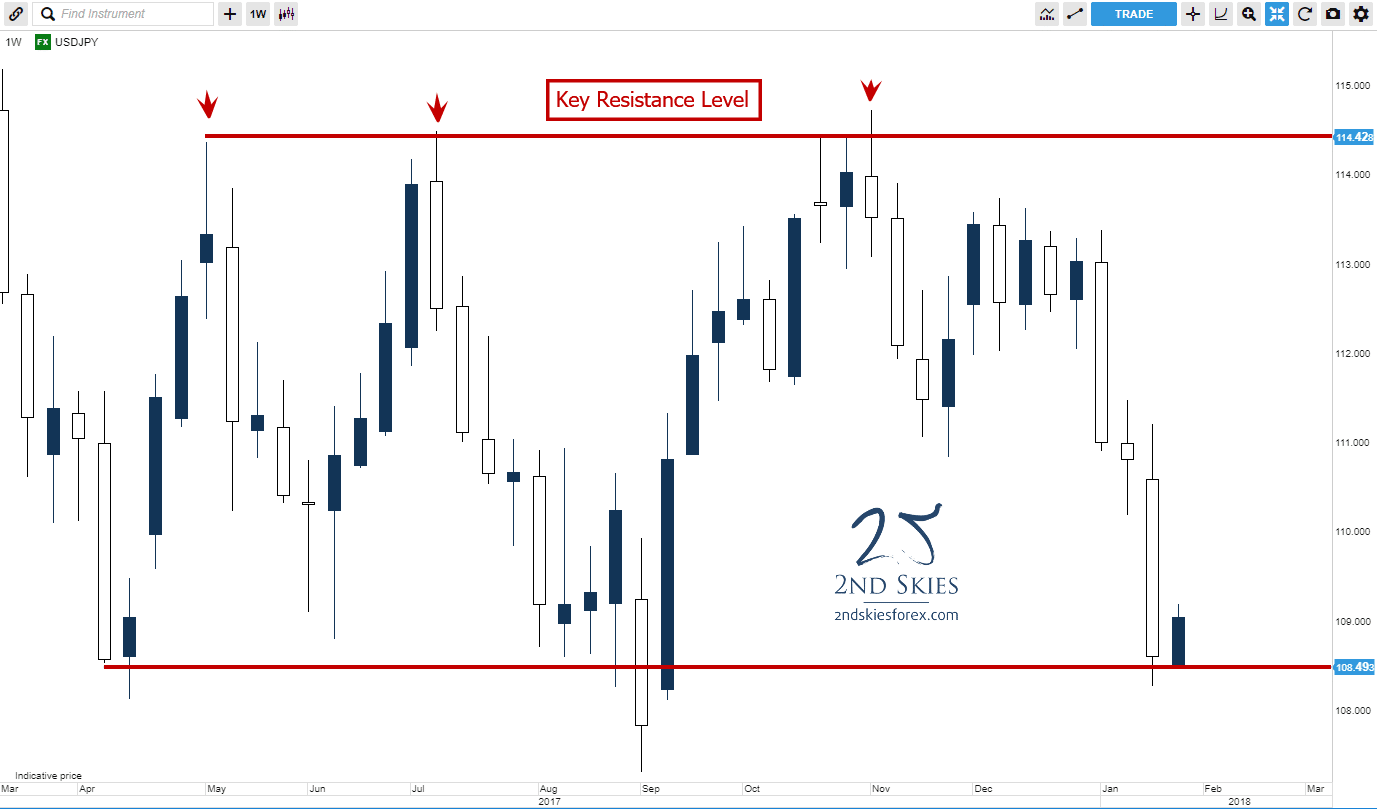
As you can see from the chart above, I’ve drawn a line on top near 114.42 which I denote as ‘resistance‘.
Now here is how professional traders will attack this using the next chart below.
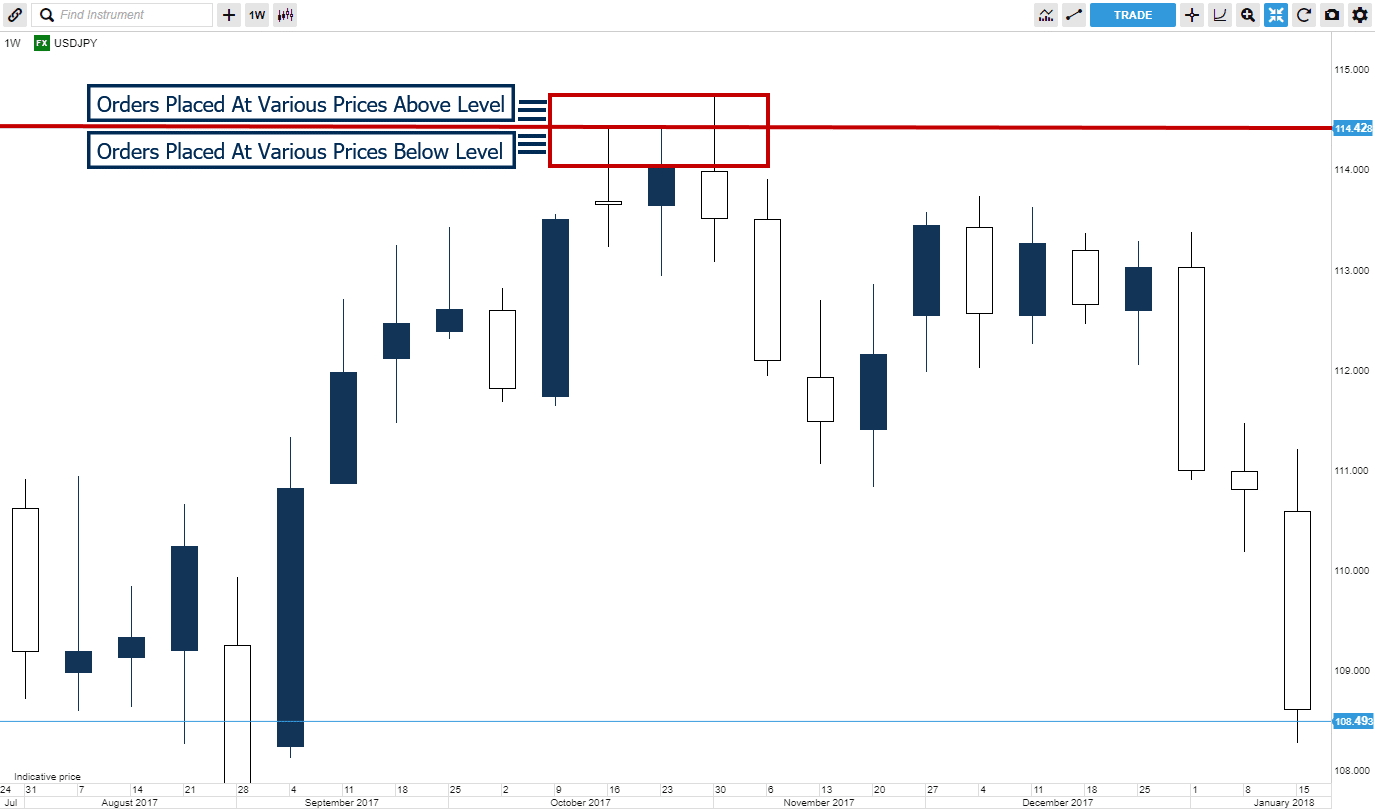
If a professional trader is bearish on the USDJPY (or thinks it’s in a range), they’ll sell the pair at or near 114.42. However, as I stated above, they’ll have different holding times and stop loss sizes. So what the order flow will look like is you’ll see various orders placed below the 114.42 level, while some will be above.
In this case, because two of the 3 wicks (in the chart above) which hit the resistance level stopped on a dime, you can assume there were a fair amount of orders just below the level. What you’ll also notice is the 3rd wick pierced through the 114.42 level, either due to a) bulls trying to push through resistance and see if they can produce a breakout trade setup, or b) traders finding liquidity just above it.
If you were able to somehow see the combined global order book for these 3 candles, most likely you’d see something like below:
Sell 10m 114.00
(with various orders selling between here and 114.42)
Sell 10m 114.42
(with various orders selling between here and 114.72)
Sell 20m 114.72
(with only a few orders above, perhaps up to 115).
While this is an overly simplified description of the order flow around this key resistance level, it serves an important point. Which is, it’s important to understand professional traders will place their orders at or around key levels. The variance in how they place their orders above/below these levels creates a ‘zone‘ of orders, which defend a level, and thus create ‘resistance‘.
If the sell orders are enough to hold any bullish pressure, the pair will sell off. If not, a breakout will likely occur, or a complex corrective structure will form.
Now the key take-home point here is: professional traders who are spotting the same level/price will most likely place their orders at/above/or below said price. This is what creates the ‘zone‘ effect, so try to avoid thinking key support and resistance levels as clear/perfect lines in the sand.
Key Point #2: The Larger The Support or Resistance Zone, The Greater the Variance in Orders Behind That Zone
In the prior USDJPY chart, the resistance zone was pretty small (about 30 pips from top to bottom). This makes it pretty easy to get some precision when selling at a key resistance zone.
But what happens when the support or resistance zone is much wider, say 100 pips or more? How do I trade that? Great question which I’ll answer below.
Meet the NZDUSD weekly chart, which currently has a wide resistance zone between .7312 and .7556, over 240 pips!
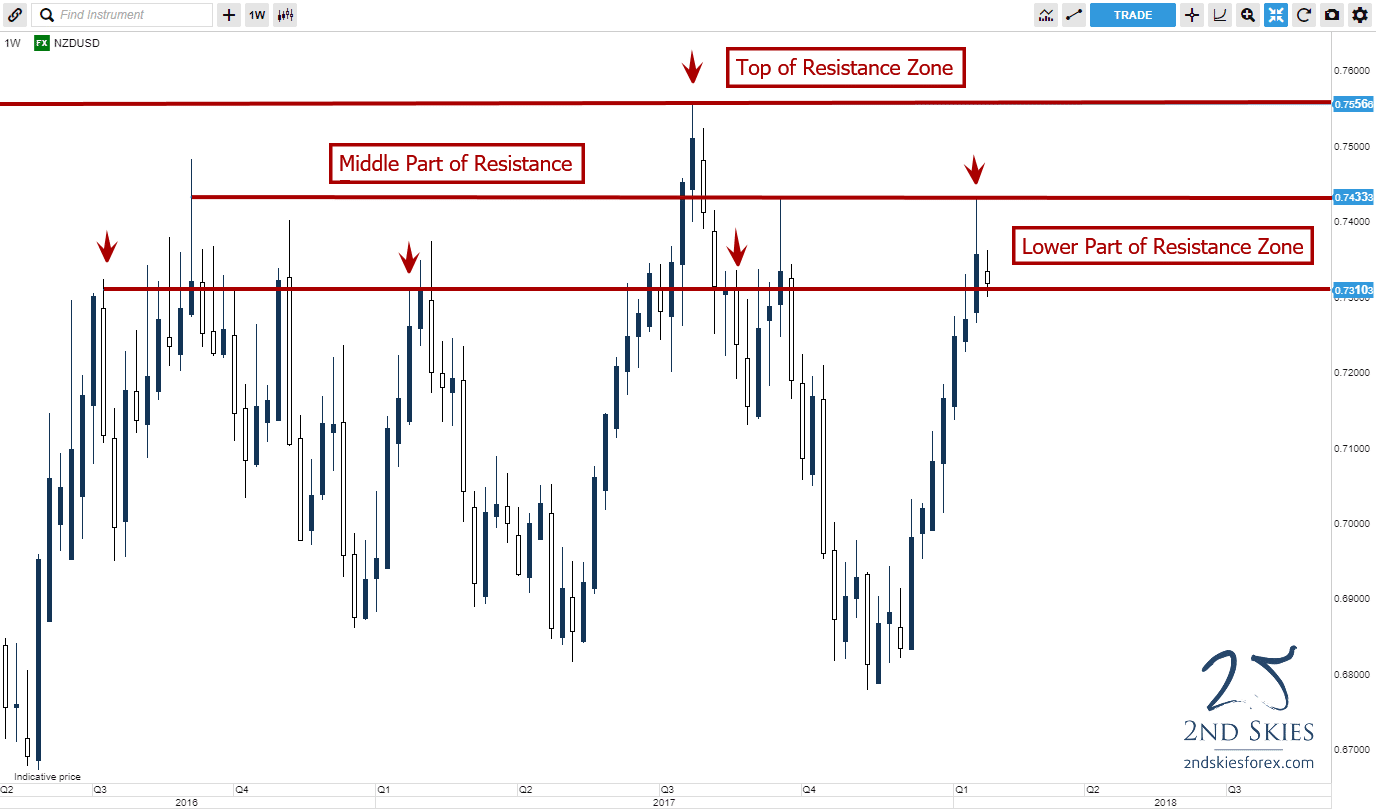
When you have such wide resistance zones, it means there is less ‘agreement‘ in the order flow between the bears in the market.
There are bears which feel .7310 is a decent resistance (as evidenced by the fact only 13 candles have closed above this since late Q2 2016). There are bears which feel strongly about .7433 being resistance as the pair has had only 2 weekly closes above this price since Q2 2016. And then there are bears which felt the extreme values for this pair should not exceed .7556. This is clearly shown since the kiwi could not produce one weekly close above this price.
So there is a lot of ‘disagreement’ specifically where resistance is, but there is agreement that this ‘zone‘ is resistance. Now anytime you encounter a zone (wide or small), you are faced with the same 3 trading choices when it comes to shorting it:
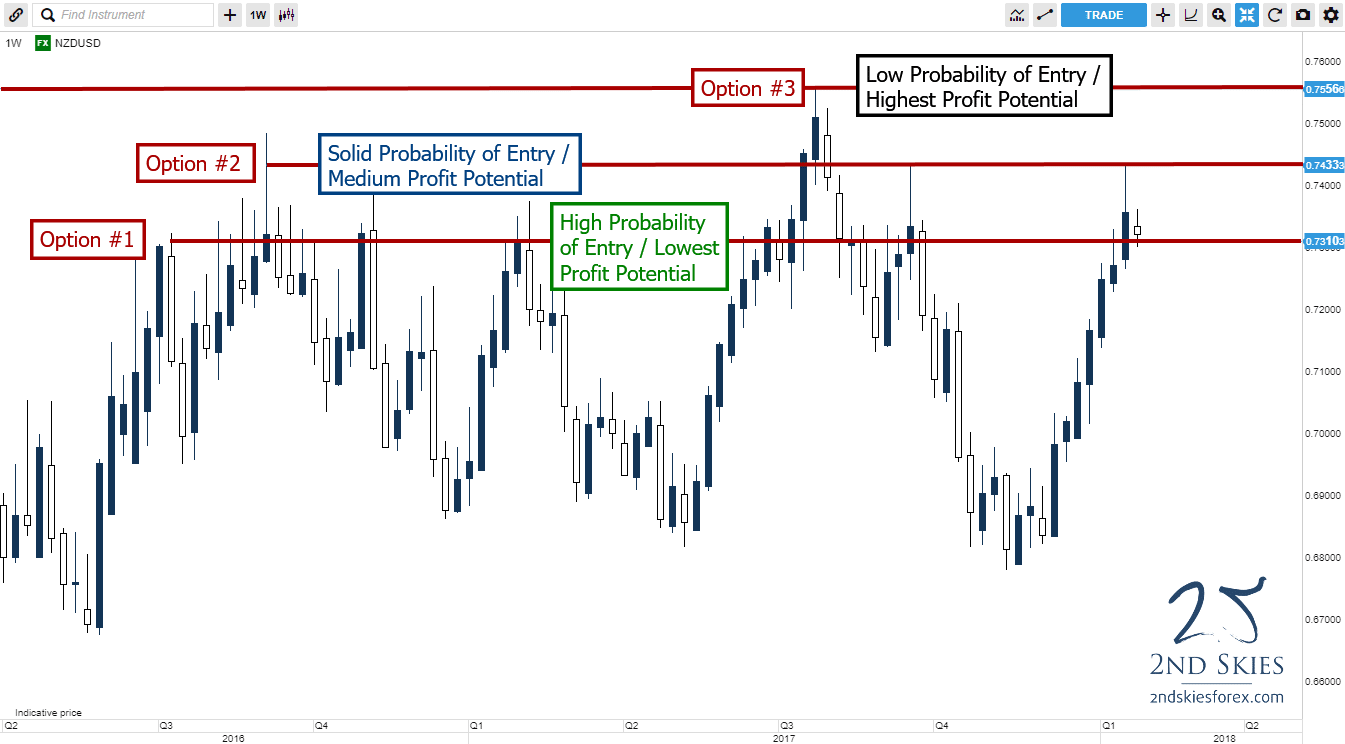
Support & Resistance Zone Trading Option #1: If you want the highest probability of getting in the trade, you’ll want to target the bottom of this resistance zone (flip this for support zones…e.g. top of the zone). By getting in a part of the resistance zone frequently touched, you’re increasing the probability you’ll get into the trade. The downside = a wider stop loss, which also reduces your potential profit.
Support & Resistance Zone Trading Option #2: If you want a solid probability of getting in the trade, while not wanting such a huge stop loss, you’ll want to get in somewhere inside the zone (ideally closer to the middle). This will slightly decrease the probability your trade will activate, but will increase your profit potential since you’ll have a smaller stop loss and thus greater target.
Support & Resistance Zone Trading Option #3: If you want the highest profit potential, then you’ll want to get in at the highest point in the zone (.7433 or above). The upside here is you can have the smallest stop loss possible, and thus the greatest profit potential. The downside is your trade is less likely to get activated (i.e. .7433 was only hit 4x since Q2 17′, while .7310 was hit almost 25x).
To clarify, I have a chart below for you using the same Kiwi pair to demonstrate this.
So that is the ‘framework‘ for how to think about support and resistance zones and how you should trade them. You’ll need to decide how you want to trade that zone based upon probability and profit potential. Neither choice is better or worse per se stylistically. You’ll have to find which of the 3 is most natural to you.
Key Point #3: Trading Support and Resistance Zones Means Trading ‘Probabilities’
I think one of the biggest confusions about trading price action using support and resistance levels is understanding probabilities, and relating to trading (or taking your trades) based on probabilities. This ‘confusion‘ has been perpetuated by a common ‘narrative‘ that you should wait for ‘confirmation price action signals‘.

Supposedly you do this to ‘confirm‘ the level will hold, and thus be more ‘probable‘. The fact of the matter is, most professional traders have already decided what level and price they want to enter, well before any said pin bar, fakey or ‘confirmation price action signal‘ has formed.
The underlying order flow is generally clear to most professionals before these 1-2 bar candlestick patterns have even formed, so they know which direction is more ‘probable‘, along with their trade location.
And considering nobody to date, after decades, has been able to establish with a verified live trading account, or with statistics that trading pin bars off key levels gives you a greater probability the trade will work out (+ profit), this narrative is quite dubious and making traders more confused about trading key support and resistance levels. But I digress…
When you boil it down, there are two key points to understand here:
#1: Either the level will hold or not
#2: The order flow (and probabilities) are most likely in place whether a key support or resistance level will hold (or not)
“What the above means is you will never ‘know’ if the level will hold or not. You only have probabilities to work with. Hence you have to approach it ‘probabilistically’ (which negates looking for ‘confirmation’)”
The best way to determine either of the above is by learning how to read price action context and the order flow behind it. The context will create a ‘structure‘ which is reflective of the underlying order flow. 1-2 candlesticks likely isn’t going to change that, nor are they more important than an entire structure. Hence, when you can learn to read price action context and structures, you’ll be able to see which level is more likely (and probable) to hold (or not).
By doing this, you’ll be getting better trade locations than you would with any pin bar or confirmation price action signal. I demonstrate this clearly in my latest live trade video for +480 pips and +5R profit. Try to find a better entry using a pin bar (you won’t).
Hence by learning to trade without confirmation price action signals, and to understand the context in terms of probabilities, you’ll avoid missing perfectly good trades.
And if you look at my USDJPY or NZDUSD charts, you’ll see there were very few confirmation price action signals here, which = lost trades and profits.
USDJPY Weekly Chart
NZDUSD Weekly Chart
My guess is if you were to identify many key support and resistance levels over years and years of price action that produced great trading opportunities, you’ll see many times there were little or no pin bars, or any kind of confirmation price action signals, thus a lot of lost profits missing these high quality trades.
In Summary
So I’ve covered a lot of ground here regarding key support and resistance levels. The key points and methods I talked about above apply to any instrument, any time frame, or environment.
It’s important to note there is a lot more to understand when trading or finding key support and resistance levels. Such as how ‘clean‘ a level is, when a level is more likely to hold (or fail), what are the best levels to trade, how to find key levels using daily chart strategies, trading intraday, and more.
This is a big subject that cannot be unpacked fully (or well) in a single article. And it’s a skill you’ll need to build over time through practice, analysis and feedback from a professional trader and mentor.
Now if you want to learn more about forex trading key support and resistance levels, and improve your ability to find the best ones to trade, then check out my online price action course where we have over 5 hours of video lessons on this, along with quizzes, analysis and feedback from me and my senior students on how to find and trade the best levels.
Now Your Turn
Did you find this support and resistance level article useful and learn something new? If so, then make sure to leave your comments below, along with share/like/tweet it with others.
I’ll look forward to hearing from you.

I’ve read several of your articles on support and resistance, Chris.
This article is the most helpful yet.
The part that really struck me is this quote:
“The fact of the matter is, most professional traders have already decided what level and price they want to enter, well before any said pin bar, fakey or ‘confirmation price action signal‘ has formed.”
That answered a lot of questions for me.
Thank you.
Hello Mez,
Yes, I’m glad you found this quote useful as it should change the way you approach price action and trading.
Kind Regards,
Chris
Hi Chris, this article has really helped me fully understand why we should always look at S & R as zones, and not as pure lines. Now, I’d appreciate if you could answer a couple of questions.
1) When discussing different holding times, do you mean by “different holding times” different time-frames like 15 minute chart, weekly chart or daily chart that different traders are trading in?
2) Does “m” in the phrase “Sell 10m 114.42” refer to “million” as in, for example, Sell 10 millions of contracts (units) of USD?
3) Can I say that you as a Price Action Context trader never use Fibonacci levels to help you find the key support and resistance levels? So, instead, you always first find that middle S or R line based on the price action context, and then just draw the top and the bottom S or R lines that are equally (symmetrically) distant from the middle one, correct?
In advance, thanks a lot for your answers.
Bruno
Hello Bruno,
1) Yes, professional traders trade all kinds of time frames. Some the weekly, some the daily, some the 4hr, some the 1hr, some the 5m.
2) Yes, m = million in notional volume
3) No, I do not use fibs. And I’m not looking for a ‘symmetrical’ zone. You have to relate to the zone as is. This is a skill that you can build in time.
Hope this helps
Hey Chris 🙂 Excellent article and very helpful. I struggle sometimes with S&R levels and narrowing down the “major” ones and the “minor” ones. I end up having so many lines with S&R zones it’s ridiculous! I’m working on just looking for the major ones on higher TF’s, while keeping in mind the minor ones on the lower TF’s. I guess one never stops learning do they??! Thanks again Chris!
Hello Cherie,
Try picking your top 2 support and top 2 resistance levels, then just focusing on those and forgetting about the intra-day ones.
Try that and let me know how it goes.
Top article of support & resistance level from insider vision.
Hello Rahmath,
Thank you – am glad you liked the article.
Great article as always Chris!
Thanks Tom.
Much appreciate and good to hear from you.
YOUR ANALYSIS ARE ALWAYS SCIENTIFIC…WHICH MEANS THEY ARE VERIFIABLE …PLEASE KEEP IT COMING ,GOD WILL CONTINUE TO GIVE YOU MORE KNOWLEDGE
Hello Taiwo,
Thanks for the positive comment. Much appreciated.
Your course help me a lot in improving my trading performance.Thanks Chris.
Glad to hear the price action course has helped you improve your trading performance.