Chris Capre’s live open price action and ichimoku trades: EURUSD, GBPUSD, AUDJPY, EURJPY, EURCZK, EU50
New to Forex? Then check out my FREE Learn Forex Trading Course with videos, quizzes and downloadable resources
What is our preferred web based trading platform? Check out our latest platform review on the xStation 5.
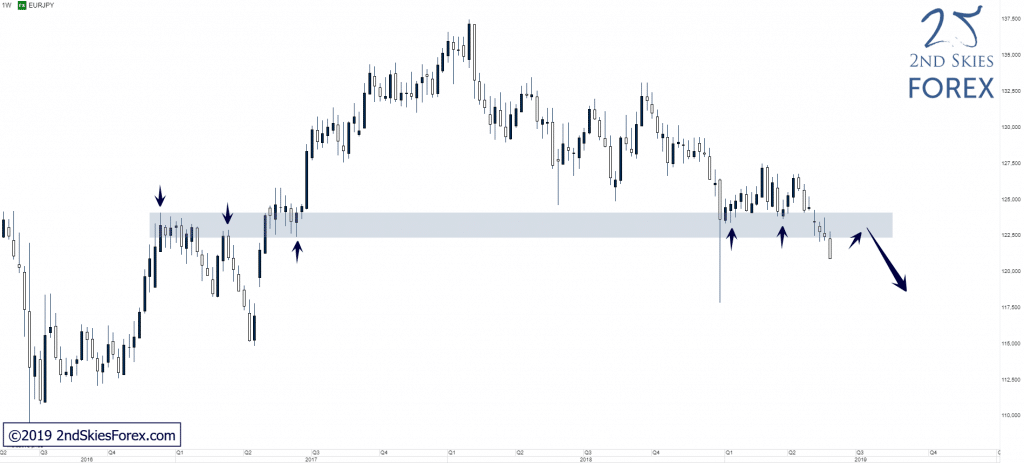
EURJPY – Strong Weekly Close Below LT Key Support, Now Resistance (Weekly chart)
Price Action Context
The potential strong weekly close below the LT key resistance zone we hinted about in our mid-week commentary manifested and we can consider this zone fully cleared at this point.
Trending Analysis
LT bias is bearish and bears can look for potential shorting opportunities on pullbacks towards the weekly zone, alternatively look for potential RRL plays on the H4 charts where currently a MT CVT is in play.
Key Support & Resistance Zones
R: 122.50 – 124.00
S: 118.60 – 117.70
Stay up to date with our members daily trade ideas for ongoing commentary.
******
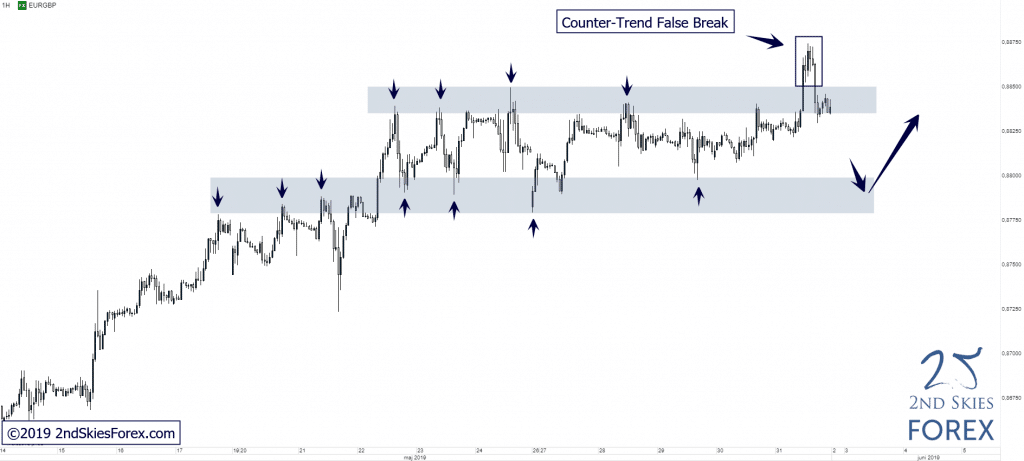
EURGBP – Counter-Trend False Break @ Top of SCS (1h chart)
Price Action Context
As already mentioned in our daily trade ideas on Thursday, EURGBP is trading within a SCS on top of a bull trend. Price is extended from its mean on the HTF, suggesting a ST exhaustion and towards the end of past week, bulls failed to push price further north, printing a counter-trend false break setup at the top of the SCS.
Trending Analysis
The false break at the top of the SCS opens up for a likely move back towards the support of the corrective structure which can offer potential buying opportunities to bulls. Should the SCS support fail to hold, a move down towards the LT support we’ve mentioned in earlier commentaries is likely IMO, which can offer further trading opportunities to bulls.
Key Support & Resistance Zones
R: 0.8835 – 0.8850
S: 0.8780 – 0.8800
******
Hang Seng 50 – Bearish CVT Still Alive (1h chart)
Price Action Context
The ST bearish CVT is still alive and has offered multiple potential RRL-plays since we we mentioned it in our market commentary on the 19th of May. Congratulations to those of you who were able to take advantage and profit from these ST trading opportunities. The trend seems to be slowing down slightly as the bearish impulsive moves are getting weaker, but as long as the price action does not break back impulsively above the last broken support, the trend is in play.
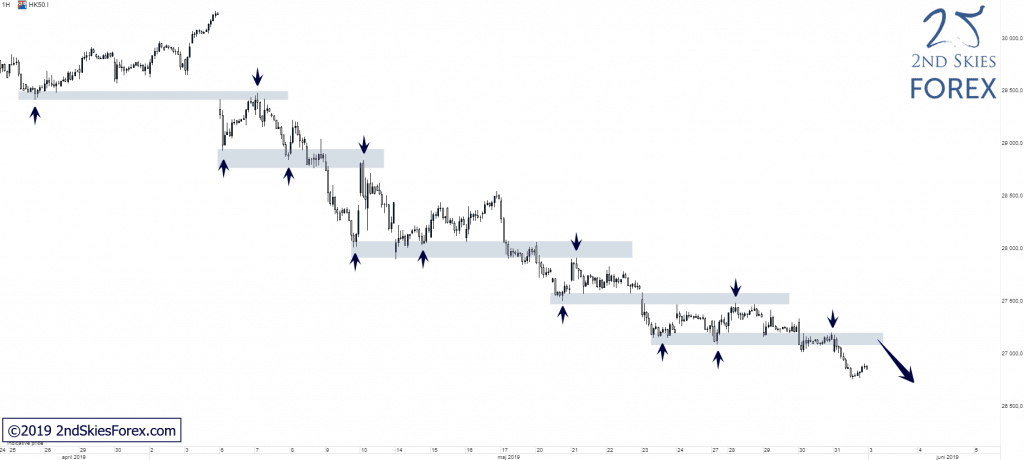
Trending Analysis
HTF is non-volatile + MT & ST bias are bearish and bears can look for potential shorting opportunities on weak pullbacks towards the last broken ST support, now resistance.
Key Support & Resistance Zones
R: 27 090 – 27 200
S: 26 500 – 26 750