Want FREE Trading Charts For Forex, Stocks or any asset class? Check out our top charting provider Trading View.
Check out my latest video How To Day Trade Stocks Using Volume
Want my Price Action Course for FREE? Click here to find out how.
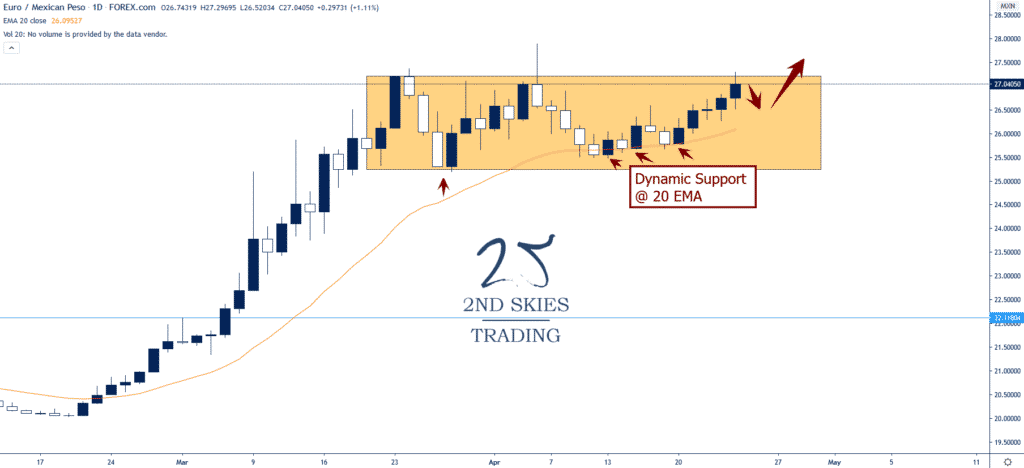
Forex Trade Idea: EURMXN – Holding Dynamic Support, Potential Breakout (daily charts)
Price Action Context
As we wrote in our ‘Is the stock market going to crash?‘ article, we suggested shorting EM FX, particularly MXN, RUB & ZAR.
The EUR has been particularly strong against MXN and has formed a corrective structure at the top of its recent bull move (yellow box).
With pullbacks holding at dynamic support (20 EMA) and continuing to press the highs, I’m suspecting this will form a breakout setup to the upside.
Trending Analysis
ST & MT bullish while above 25.25 on a weekly closing basis. Watching for breakout setup to get long.
Key Support & Resistance Levels
R: 27.04, 27.85
S: 26.11, 25.20
Stay tuned to our members market commentary for updates.
******
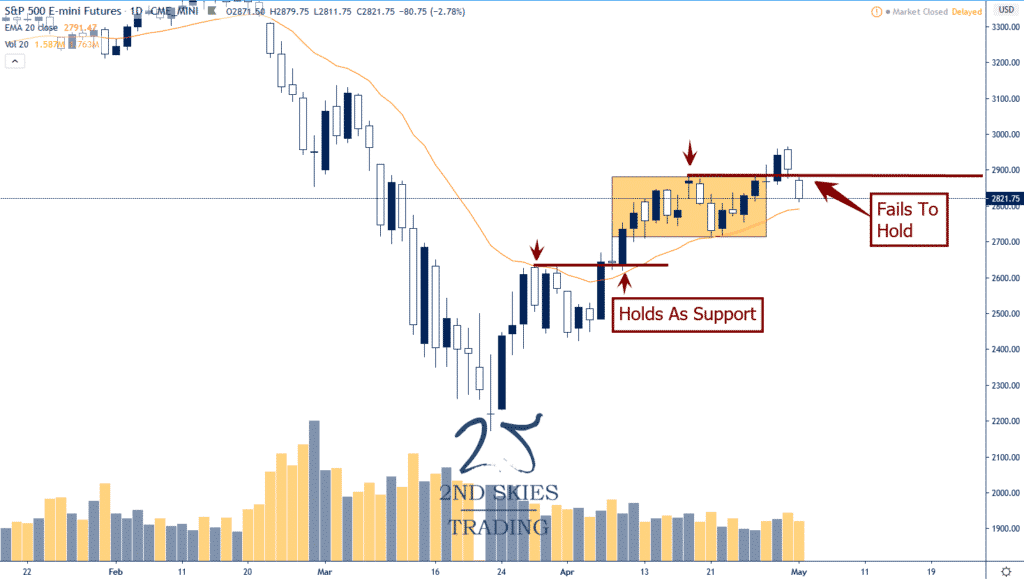
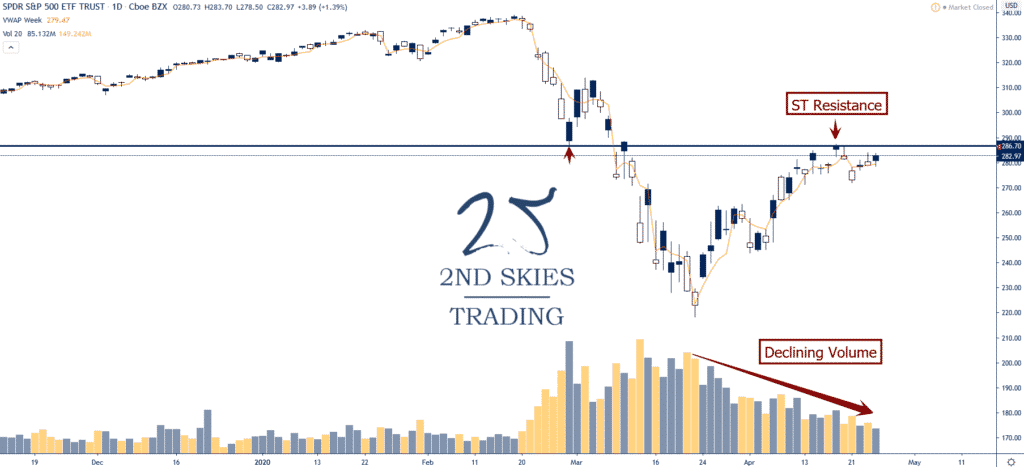
ETF Trade Idea: $SPY – Some Weakening, But Still Bullish (daily chart)
Price Action Context
Bouncing with the overall market (on low volume of note), the $SPY (S&P ETF Index) has showed its first signs of weakening being the first week in many to not close or push above the prior weeks high.
This alone is not enough to call the top of this bounce, but its the first sign showing some weakening in the $SPY.
If we start to see more signs in the price action, then it may be slowly starting to roll over as CTA’s and momentum chasers reduce longs.
Trending Analysis
ST bullish but MT needs to clear 287.30 to add fresh technical momentum
Key Support & Resistance Levels
R: 287.30, 302
S: 272, 262
******
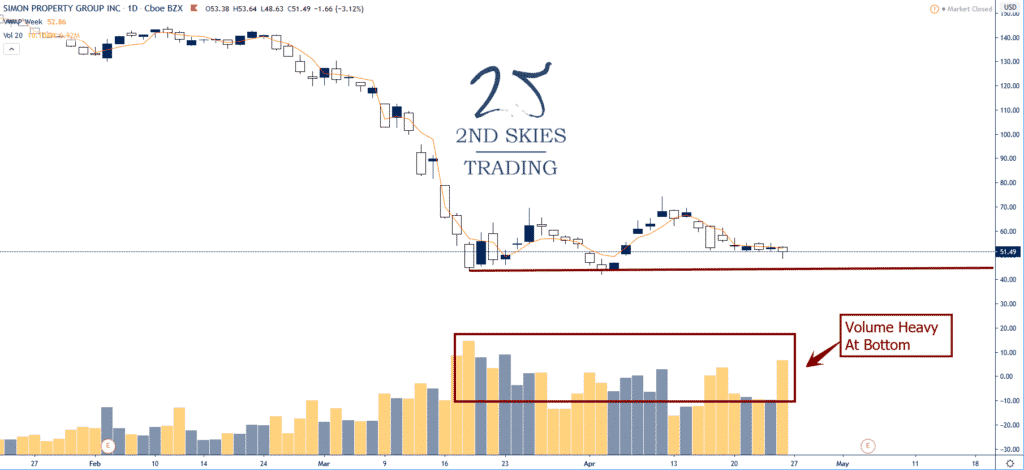
Stock Trade Idea: $SPG – Barely Holding Lows, Potential Downgrade (daily chart)
Price Action Context
Commercial real estate has been getting clobbered with foreclosures and missed rents as of late.
Simon Property Group ($SPG) hasn’t been spared and cannot seem to get up off the mat, barely holding above the lows while others have rebounded.
Take that + a potential downgrade and you have a recipe for low buying interest and a potential breakdown.
Trending Analysis
ST & MT bearish while below 70 on a weekly closing basis.
Key Support & Resistance Levels
R: 68.63, 73.83
S: 43.78, 40