What’s inside today’s trading article?
- How to find the strongest support and resistance levels
- What variables should I be looking for when picking my key support and resistance levels
- How do I know how strong a major support and resistance level is?
Being able to find high probability key support and resistance levels is an important skill you’ll need to build to become a profitable trader. There is no way around this. If you’re wanting to trade price action, you’ll have to learn how to identify and trade key support and resistance levels.
One of the more common questions I get from struggling traders is “how do I find the strongest support and resistance levels?”
In this week’s trading article, we’ll answer this question, along with what variables you need to look for in finding key support and resistance levels, and how to identify the overall strength of that level.
Let’s jump in…
The Mindset Around Key Support & Resistance Levels
First off, it’s important to understand you need a particular mindset and understanding about support and resistance levels. What I’m particularly referring to here is that you have to view S/R levels ‘probabilistically‘. You cannot think of them as black or white, good or bad, going to hold, or not going to hold.
Trading doesn’t work like that, nor does price action, nor does S/R levels. You have to trade and think in probabilities. There is no way around this!

Just want to get this out of the way.
Also, it’s important to think of S/R levels more as ‘zones‘ and not fixed lines in the sand. This means you realize there isn’t one price where the support or resistance is broken. So you cannot think of it like “if the EURUSD breaks 1.1350, I’m bullish, but if it’s at 1.1349, I can’t be bullish“.
Order flow doesn’t work like this, nor are all large institutional players and hedge funds parking their buy/sell orders at the same price. They will often ‘cluster‘ their orders around specific prices. And it is this small cluster (or range of prices) which constitutes the ‘zone‘.
So avoid the trap of relating to support and resistance as a single price or line in the sand. Think of them as ‘zones‘ of important order flow.
How To Find The Strongest Support And Resistance Levels (in all financial markets)
The strongest support or resistance levels will more often than not be with trend. What this means is, if we are in a bull trend, pullback levels to support will more often than not be ‘stronger‘ than resistance levels above. This is because the underlying order flow in a bull trend is more dominantly on the buy side. Holding multiple tests of a with trend level usually is a good indicator of it’s level of strength.
Until the trend changes, hedge funds and large institutional players will be looking to buy more than sell, so the order flow on those pullback levels will often be ‘stronger‘ than resistance levels, which will often fold faster.
Below are a couple examples.

In this chart on the USDMXN (daily chart), notice how the resistance levels only survive a few touches before breaking, while the key support levels survive multiple touches before creating a new leg higher? This should tell you where the dominant order flow is (on the bull side) and that until you see this structure and order flow changing, you want to be trading with trend as much as possible.
NOTE: If you want to see a good example of me trading with the trend using key support and resistance levels, click on that link to watch a video of me profiting +300 pips trading S/R levels.
Another example of how a with trend support level held multiple touches is in the USDJPY (daily chart).
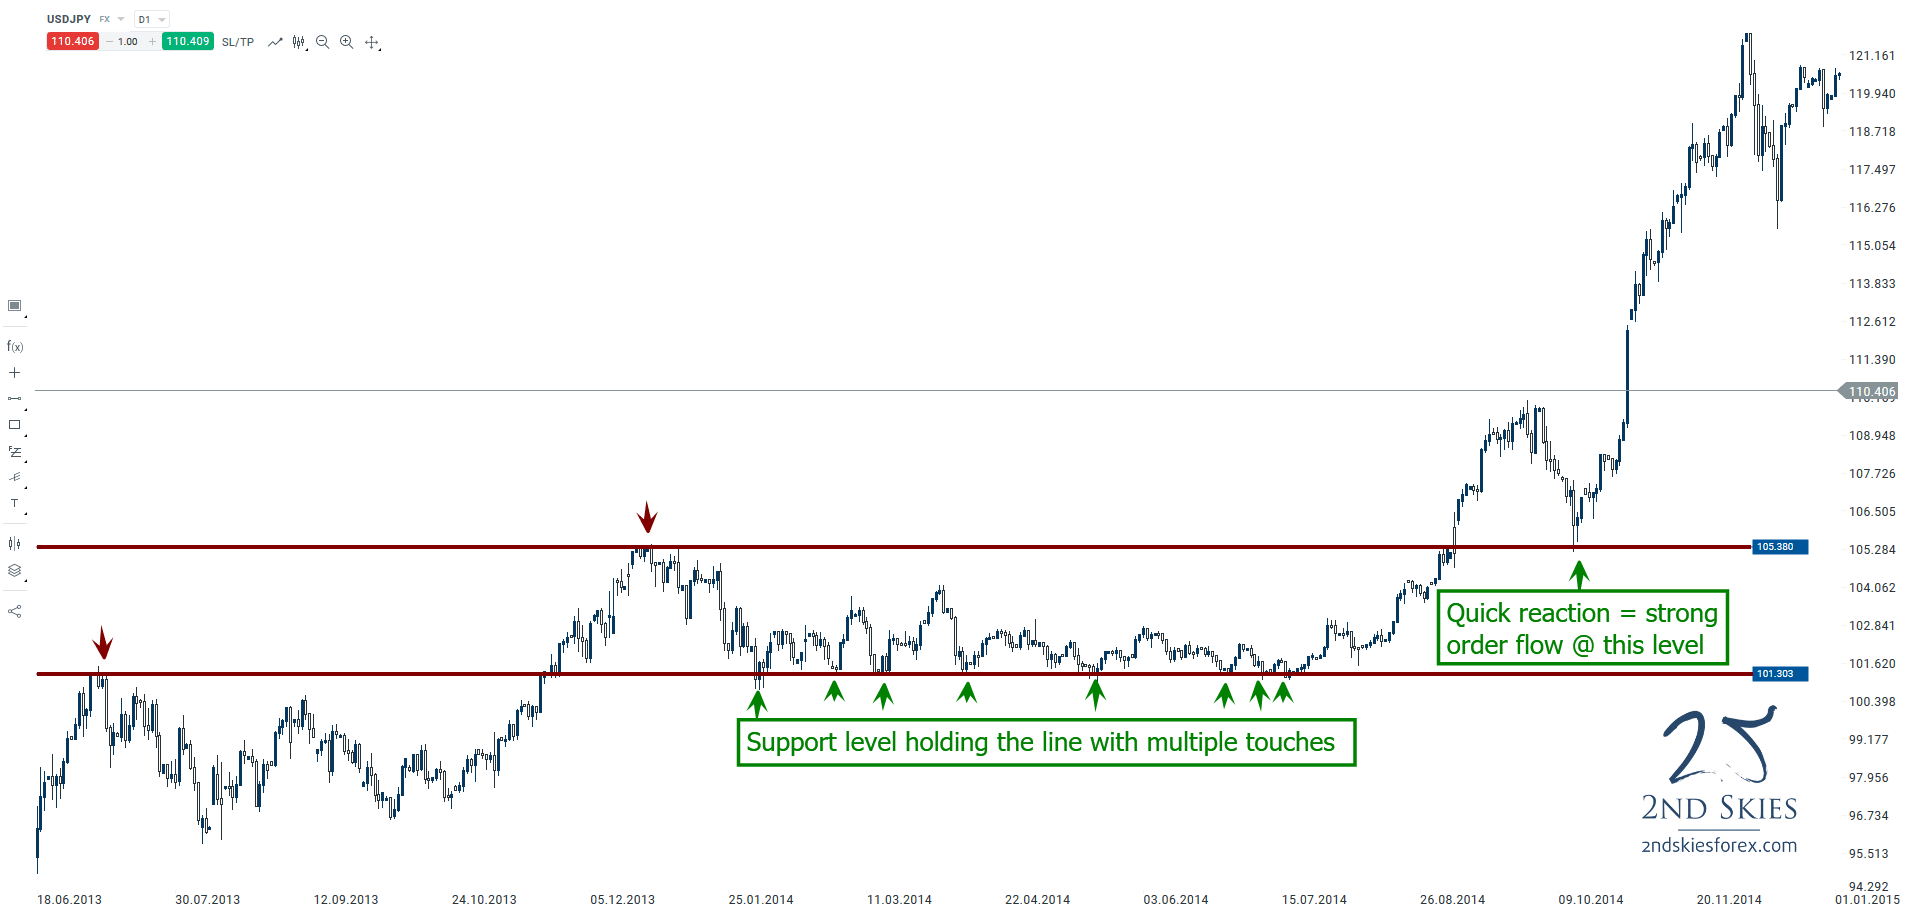
Notice how the support levels held multiple touches in the middle. The ability to withstand multiple touches tells you the more dominant order flow is on the bull side as they’re able to handle multiple tests while holding the line.
Also notice how the last support level (~105.38) was just barely touched before producing a super strong bull move? Quick reactions that take out prior swing highs often denote impulsiveness and a strong amount of order flow present to hold the level for 1-2 candles before rocketing higher 1500 pips. So make sure to note these variables as demonstrating strength in a particular level:
- holding the line after multiple touches
- strong/short reactions from a key S/R level
- with trend levels will often be stronger than counter-trend levels
Now that you have a few variables to look for, make sure you build your skills in identifying these variables till they become sub-conscious.
What Other Variables Should I Be Looking For When Picking My Key Support And Resistance Levels?
Besides looking for with trend levels, another good variable to look for are corrective structures with multiple touches on both sides of the market.
A really good example of this lately has been the AUDJPY which we’ve talked about in our market commentary recently.
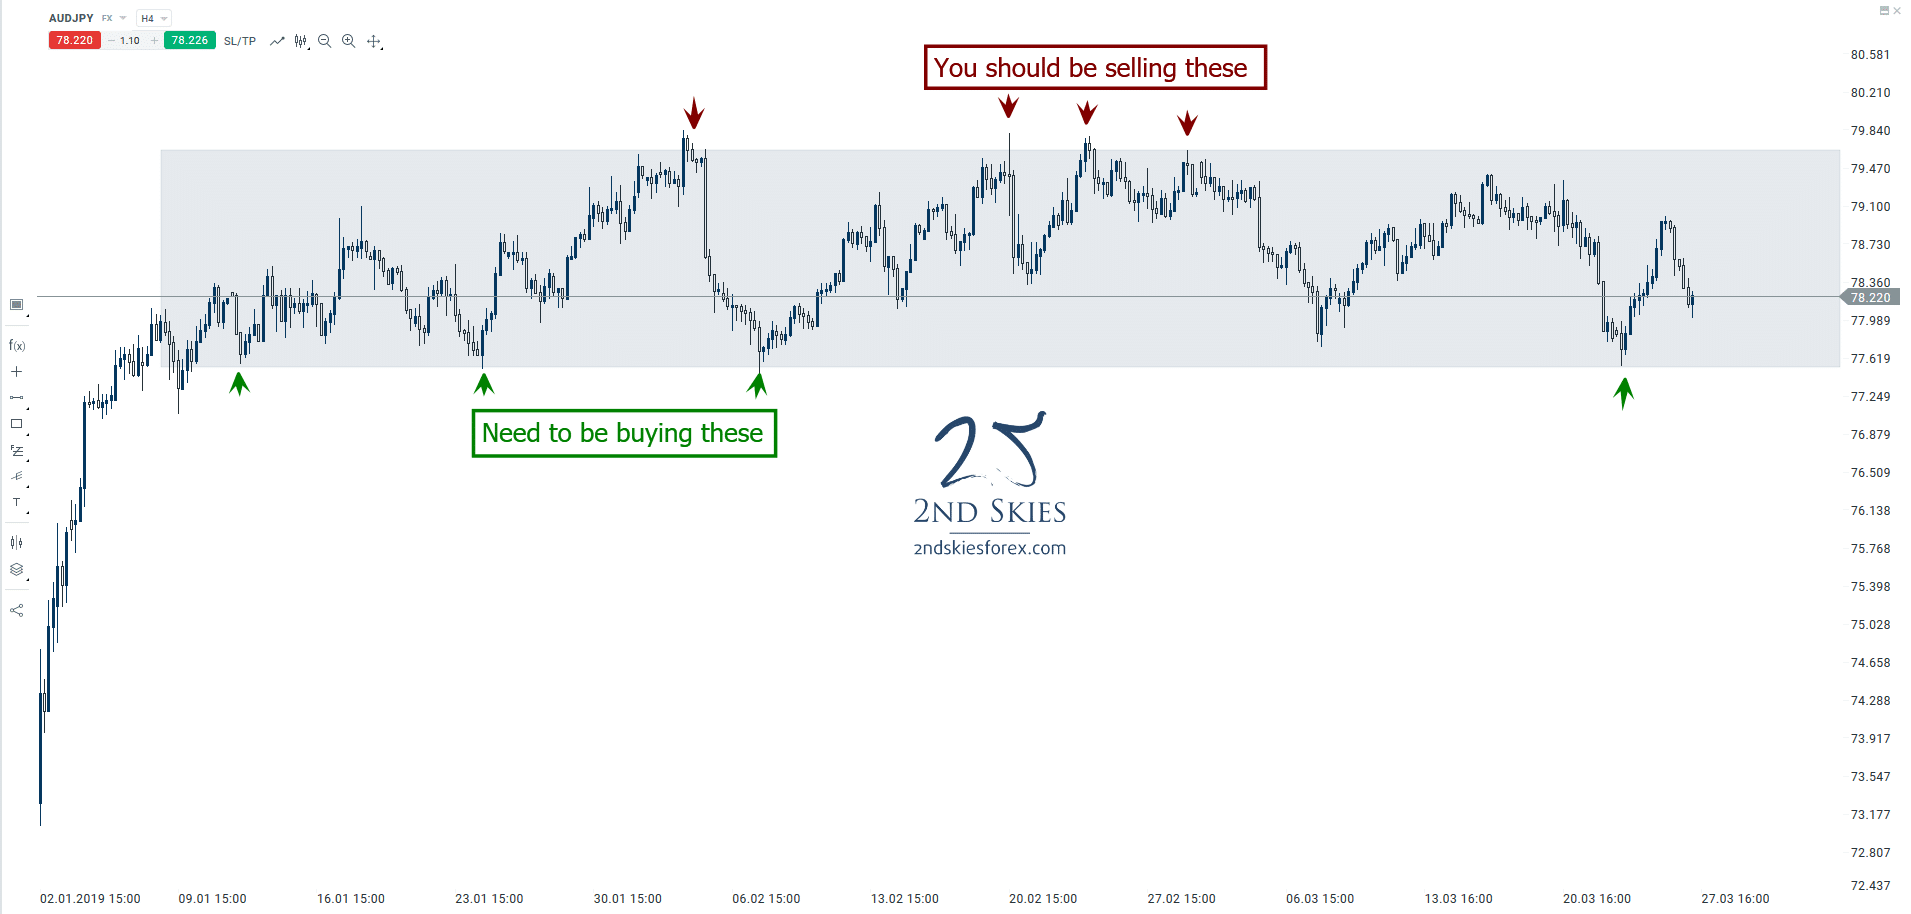
Looking at the 4hr chart, you can see in the box how the price action has had multiple touches on the top and bottom of this corrective structure. What this communicates from an order flow perspective is that both sides of the market are in a state of balance, so neither side is dominant and ready to take over yet.
When you have corrective structures like this, it’s important to be trading both sides of the market until the structure breaks. This will give you a lot of trading opportunities with small stop losses (i.e. above/below the structure) while targeting the other side of the corrective structure.
In most cases, this structure would have offered several +3-4R trade setups. It is something we talked about with our members ahead of time, so congratulations to those students who profited from these trades.
NOTE: You can watch a live trade video of me profiting +160 pips trading off a key support level here.
Moving forward, you can see another example of these corrective structures on the ASX 200 1hr chart.

Although the levels are not as ‘clean‘ as the AUDJPY chart, the overall corrective structure is there and with a little more buffer, has offered multiple day trading setups for about +2R.
Hence learn to identify corrective structures with multiple touches on both sides of the market and look to trade both sides until the structure is broken.
In Summary
There are many tools and variables you’ll need to identify in the price action which can help you find strong support and resistance levels. Keep in mind, this is a skill that takes time to learn, so don’t expect to read an article and be a pro. You’ll have to build your skills in this over time. If you do this right, you’ll find yourself identifying and trading stronger support and resistance levels.
In our Trading Masterclass course we cover many other variables you’ll need to learn to find the best support and resistance levels. On top of the many lessons we have on S/R levels, we also have market commentary and trade ideas for our members 4x per week where we are identifying the most important support and resistance levels, so you can continually improve your skills.
To learn more about becoming a member and getting access to these lessons + market commentary, click here.
Until then, I hope you enjoyed this article on finding the strongest support/resistance levels, and make sure to leave a comment below.
Additional Articles/Videos To Study:
1) Live Forex Trading +480 Pips on EURUSD
2) Confirmation Around Key Support & Resistance Levels
3) Live Price Action Trade – Pullback To Support Level For +7R