Chris Capre’s current open price action and ichimoku trades: EURUSD, GBPUSD, USDMXN, USDJPY, BIR, TL
NOTE: Every trader has to go through stages to make money trading. Which stage are you at? To find out, read my article The 4 Stages of A Millionaire Trader.
GBPUSD – Potential ST Exhaustion Into Key Resistance (Daily chart)
Price Action Context
In December last year, sellers initially were able to clear the LT key support, but the bearish continuation failed and buyers pushed price back above the key support, which since has been followed with very strong buying, now starting to look like a ST parabolic move and exhaustion price action into the key resistance ahead.
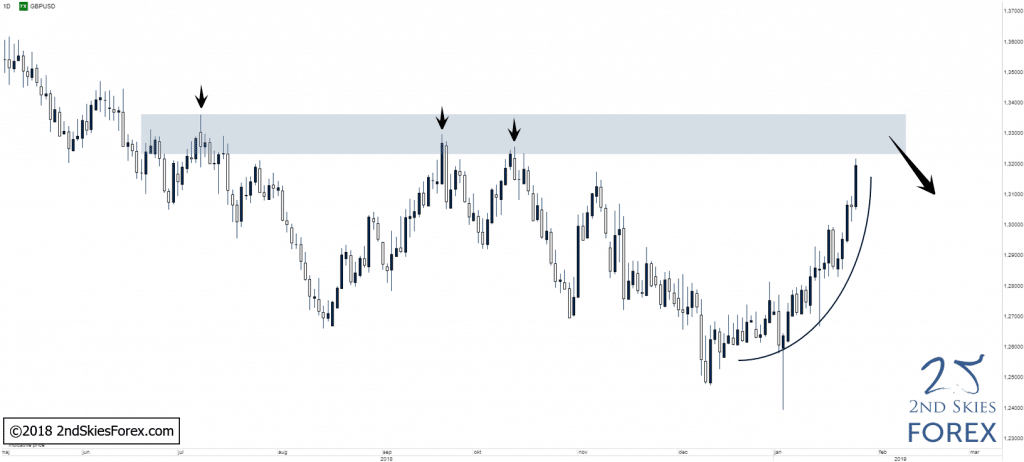
Trending Analysis
Bearish while below 1.3370 and the key resistance can potentially offer shorting opportunities to bears.
Key Support & Resistance Zones
R: 1.3230 – 1.3370
S: 1.2600 – 1.2730
Stay tuned to the daily member trade ideas for updates.
******
ASX200 – False Break @ Weekly Support (Weekly chart)
Price Action Context
The break below the weekly key support level ended up being a false break setup and after breaking and closing back above the key support, price has continued north and is most likely headed for the next key resistance.
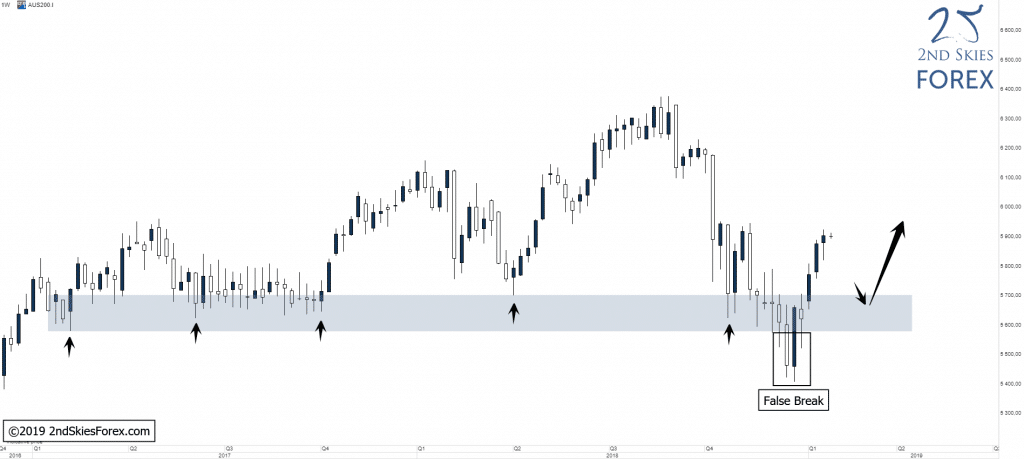
Trending Analysis
LT bias changed to bullish after the false break and bulls can look for potential bullish plays on weakness into the key support.
Key Support & Resistance Zones
R: 6 110 – 6 160
S: 5580 – 5700
******
XAUEUR – Strong Close Above LT Resistance, Potential False Break (Weekly chart)
Price Action Context
Precious metals were bought up heavily during Friday, which was the last bullish push XAUEUR needed to clear the next LT key resistance level in line. If this broken resistance holds as support, a move up towards 1160-1180 is likely IMO.
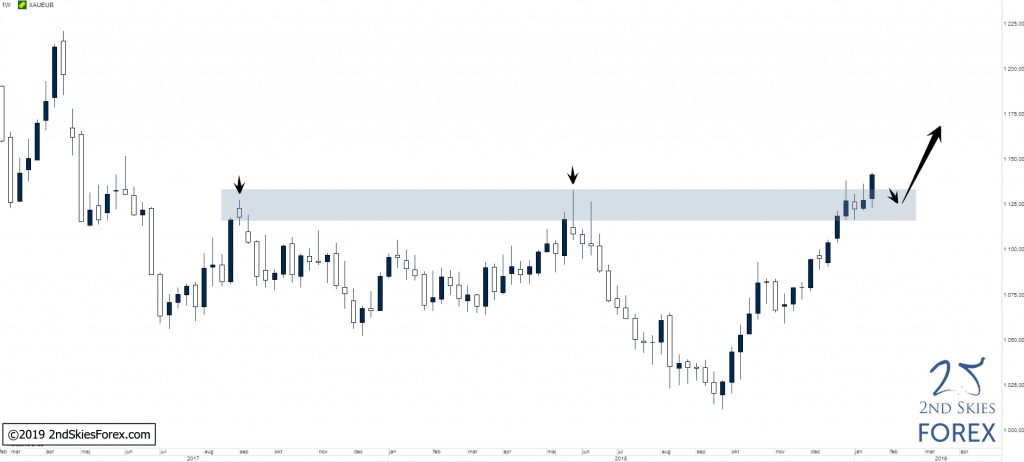
Trending Analysis
LT bias bullish and weak pullbacks into the broken LT resistance, which now should act as support, can present potential bullish trading opportunities. A break and close back below the zone would render this a false break and put 1060 back into perspective.
Key Support & Resistance Zones
R: 1 160 – 1 180
S: 1 116 – 1 134