Chris Capre’s live open price action and ichimoku trades: EURUSD, GBPUSD, AUDJPY, EURCZK, CAC40, VIX
New to Forex? Then check out my FREE Learn Forex Trading Course with videos, quizzes and downloadable resources
What is our preferred web based trading platform? Check out our latest platform review on the xStation 5.
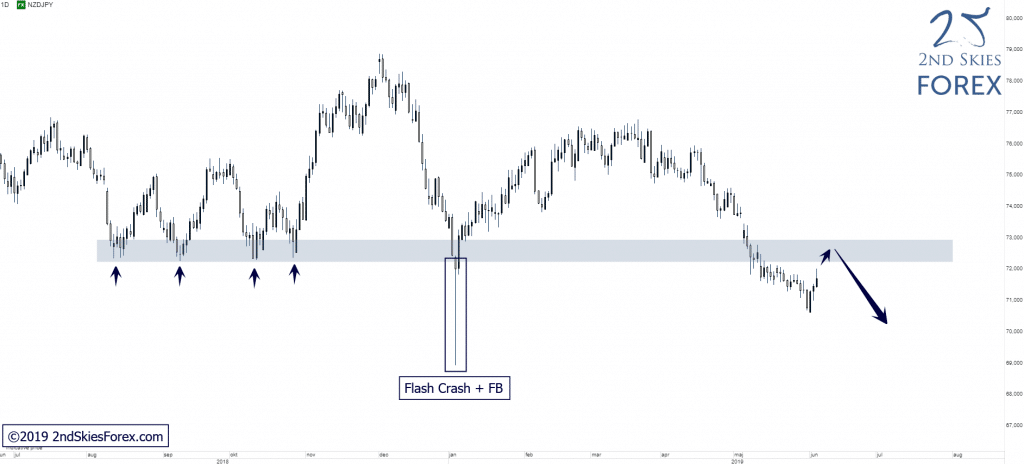
NZDJPY – Pulling Back Towards Key Resistance (Daily chart)
Price Action Context
On the 13th of May, NZDJPY cleared a LT key support zone followed by a 2-3 week correction before selling picked up again. After putting in a ST bottom + reversal around 70.70, price is now closing in on the broken LT support, now acting as resistance. If bears can defend this resistance zone successfully, a bearish continuation towards the major support around 69.80, dating back all the way to 2009, is likely IMO.
Trending Analysis
Bearish LT bias and sellers can look for potential trading locations around the key resistance.
Key Support & Resistance Zones
R: 72.25 – 72.85
S: 68.25 – 69.80