Chris Capre’s current open price action and ichimoku trades: EURUSD, GBPUSD, USDMXN, USDJPY, BIR, TL
NOTE: How do you know if you’re taking the right steps to make money trading, or skipping steps you shouldn’t? If you want to know, read my latest article The 4 Stages of Becoming A Millionaire Trader.
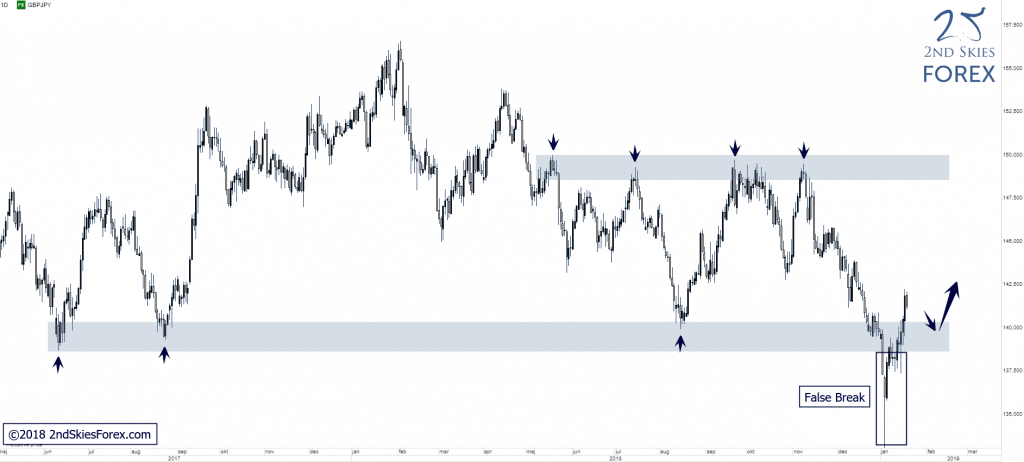
GBPJPY – Strong Rejection + False Break @ LT Support (Daily chart)
Price Action Context
After the flash crash in early January, bulls heavily rejected lower prices, resulting in a false break of two LT support zones (only upper one shown in chart). If bulls successfully can defend the closest LT support, a move higher towards 148.60 is likely IMO.
Trending Analysis
Bias changed to neutral and bulls can look for potential trading locations on weak pullbacks into the LT key support.
Key Support & Resistance Zones
R: 148.60 – 150.00
S: 138.60 – 140.30
Stay tuned to the members market commentary for updates.
******
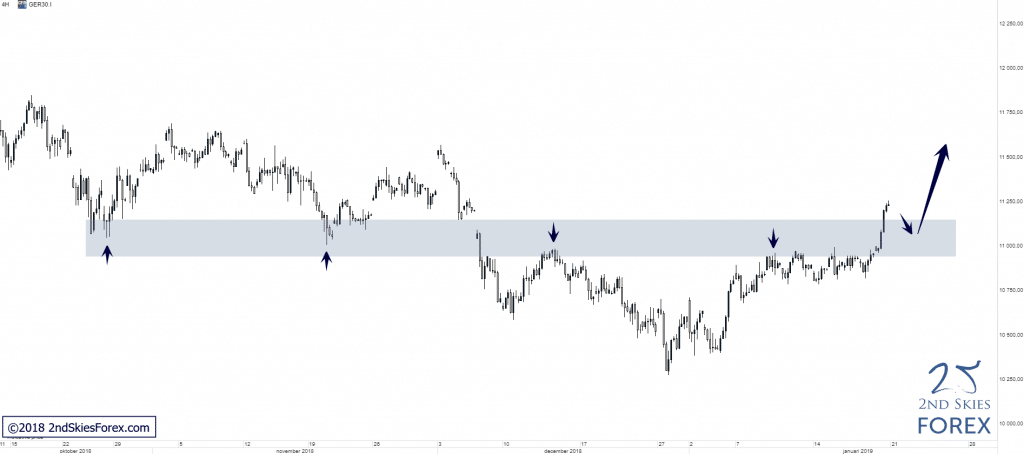
DAX – MT Trend Reversal, Broken Above MT Resistance (4h chart)
Price Action Context
After an initial CT impulsive move, followed by a corrective structure, which often is an early indication of a potential trend reversal, bulls ultimately managed to push through a key MT resistance zone on Friday, clearly closing above the zone ending the trading week.
Trending Analysis
MT bias changes to bullish and ST/MT bulls can look out for possible trading opportunities on weak pullbacks into the S/R zone (now support).
Key Support & Resistance Zones
R: 11 700 – 11 950 [LT]
S: 10 950– 11 150
******
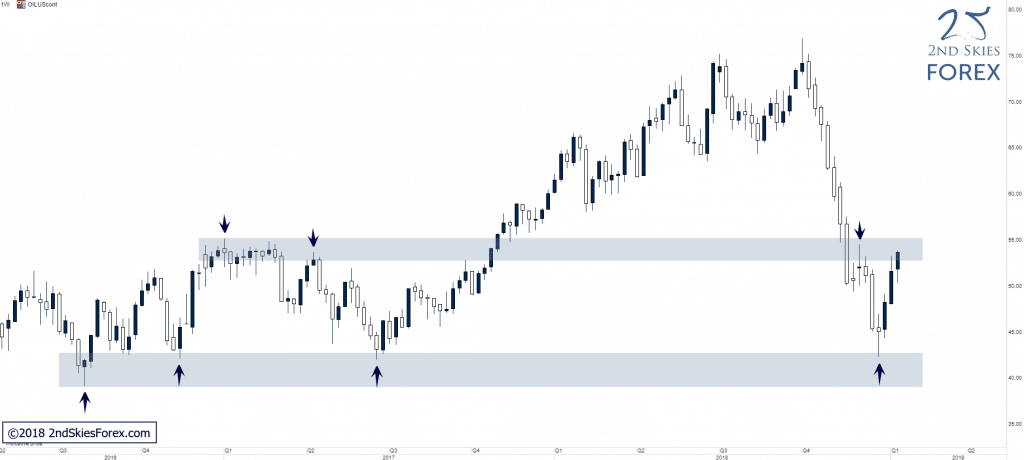
WTI – Strong Close @ LT Key Resistance (Weekly chart)
Price Action Context
Between early October and late December last year, WTI sold off roughly -40%, all the way to a major multi-year support level. The support produced a very strong rejection/bounce that has taken price all the way up to the closest key resistance with a very strong close right at the zone ending the trading week.
Trending Analysis
LT bias is bearish and if the resistance holds, a move down towards the key support is likely, whilst A failure of the resistance on the other hand would technically open up for a continuation towards 59.00.
Key Support & Resistance Zones
R: 53.20 – 55.20
S: 39.00 – 42.80

