Chris Capre’s current live open price action & ichimoku trades: USDMXN, EURRUB, EURMXN, AUDNZD, BIG, DIS, AC, ISD
New to Forex? Then check out my FREE Learn Forex Trading Course with videos, quizzes and downloadable resources
Top Trade Review: Check out our latest Forex Top Trade Review of my student making +190 pips profit on the AUDJPY forex pair.
Forex Trade Idea: EURUSD – Large Corrective Structure, Looking to Buy (daily chart)
Price Action Context
Since November of last year, the EURUSD has been trading within a large corrective structure between 1.10-ish and 1.12.
We’re going to keep playing this corrective structure until we get a weekly close outside of it, and thus are looking to buy.
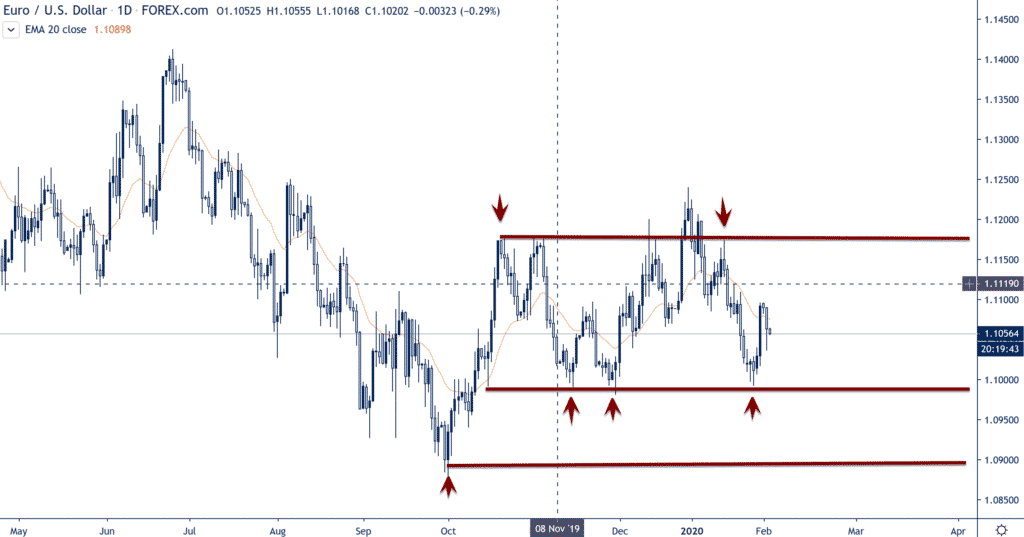
Trending Analysis
ST & MT neutral so watch structure for next directional bias.
Key Support & Resistance Levels
R: 1.0990, 1.09
S: 1.1175, 1.1245
Stay apprised with our member market commentary for updates
******
Index Trade Idea: Nikkei 225 – Trying to Hold Key Support Level (4hr chart)
Price Action Context
After a solid bull run to end last year peaking out at 24K, the Nikkei 225 has recently suffered a 1000+ point pullback, likely due to fears over the corona virus affecting the region.
Currently the index is parked inside a large corrective structure at the top of a bull run, which does point to the more probable direction being up, but we could be distributing some order flow up here.
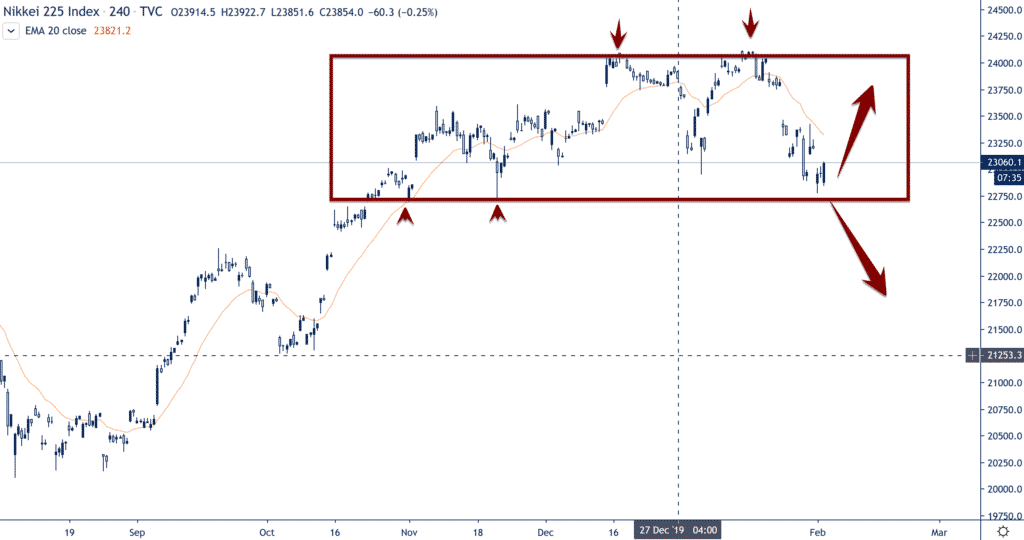
Trending Analysis
ST neutral while MT bullish. A weekly close below the structure and key support zone around 22800 negates the ST bull trend and shifts bias to bearish ST. A bounce from here puts the recent resistance level at 24K into focus.
Key Support & Resistance Levels
R: 24000, 25000
S: 22800, 22166
******
Commodity Trade Idea: Palladium (XPDUSD) – Holding at Daily 20 EMA Support (4hr chart)
Price Action Context
After the parabolic trend and exhaustion price action earlier, Palladium (XPDUSD) has found ST support at the daily 20 EMA (which comes in around 2250) and has since bounced about $100 and is attempting re-attack the recent parabolic highs.
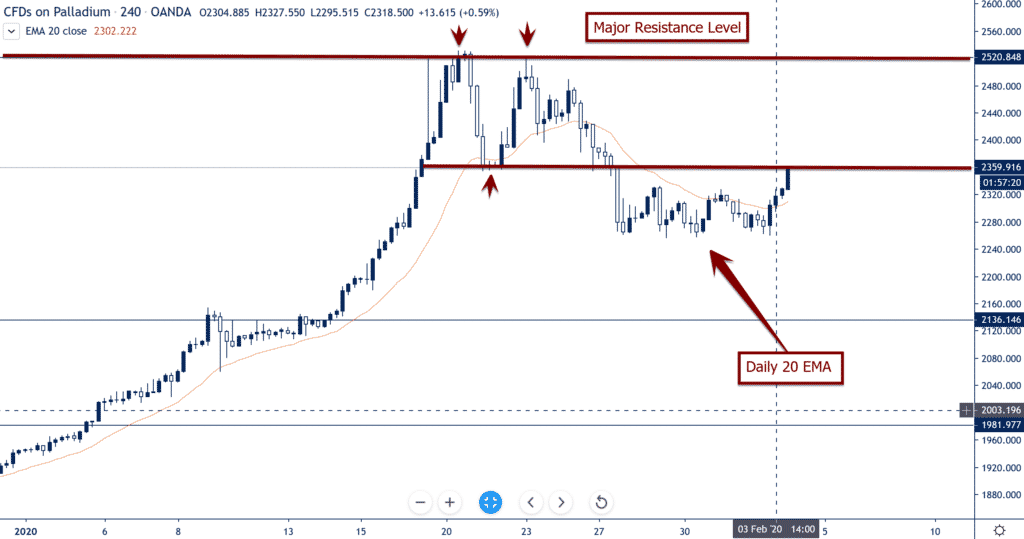
Trending Analysis
ST bullish but MT neutral to bearish while the parabolic trend highs around 2520+ are still in place.
Key Support & Resistance Levels
R: 2350, 2520
S: 2250, 2149