The Steel Dynamics, Inc (Nasdaq: STLD) stock finds itself at a pivotal point on the weekly chart. Whatever happens here would leave a mark on the stock in the near term.

Source: Movidagrafica Barcelona
The Chart Pattern of Doom
Three times since 2009. That is the number of times the Head and Shoulders Pattern appeared on the STLD stock on the weekly chart. And three times, the stock behaved as predicted by the chart pattern. On one occasion, the stock nearly defied the pattern, but nearly was not enough. Today, the STLD attempts to defy the Head and Shoulders pattern once more. Will it be successful this time?
Before we go too far, here’s a little insight into what the Head and Shoulders chart pattern is. The head and shoulders pattern, in an uptrend, appears as three highs consecutive highs, with the middle-high (head) edging out the two on either side (shoulders).
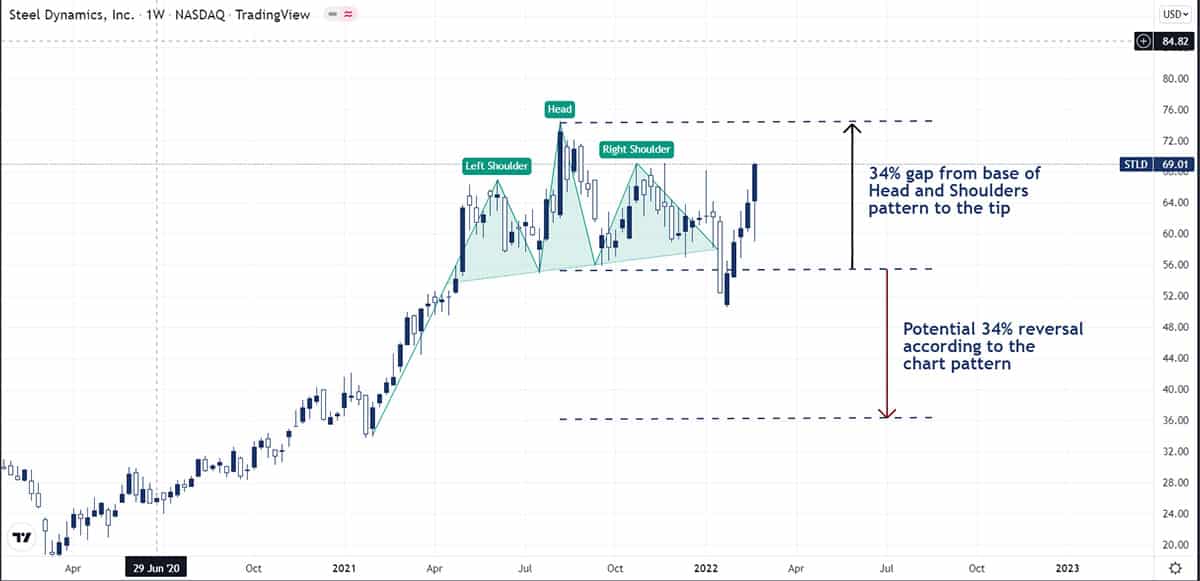
This pattern suggests that there maybe a reversal that’s at least the size of the vertical distance between the base of the pattern and the tip of the middle high. And it has proven to be fairly accurate across many stocks and other financial instruments.
As we write this, the Head of the pattern is at $74.5, which is not far away from the current price of $60. If the stock is going to defy the chart pattern, though, it will have to overcome the $65.5 – $68 resistance level that has reared its head against it. But if the chart pattern prevails, shareholders of Steel Dynamics may have to brace for a loss of 48% from the current price.
The Silver Lining
But if you look past the shadow of gloom cast on the Steel Dynamics stock by the chart pattern, the stock does look bullish. It bounced off the $50 – $53 support level in late January and now challenges the $65.5 – $68 resistance level. Should this challenge be successful, it will launch the stock into new all-time highs.
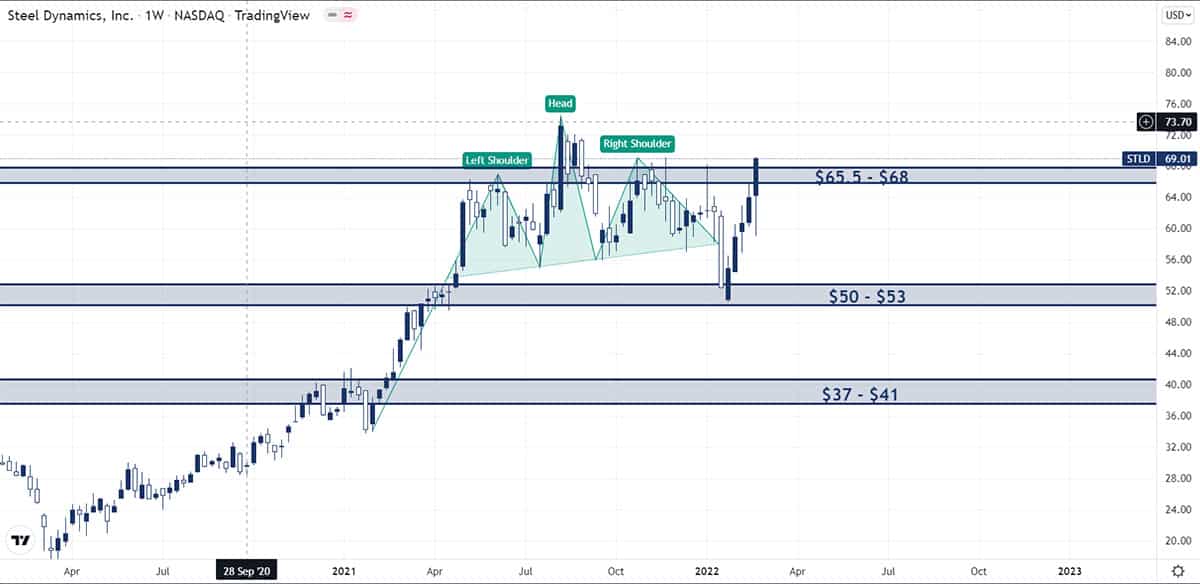
However, a failure to pull through this challenge could mean the stock returns into the range it has been in since it broke out of the $50 – $53 resistance level (now support). And if the stock falls below this level, we would be ushered into bearish territory.
Signals and Forecast
We recommend you hold Steel Dynamics stock for now. But once the stock breaks out and retests the $65.5 – $68 support, our sentiment changes to a buy. And if the stock falls below the $50 – $53 support level, our sentiment changes to a sell of a minimum of 20%.