Have you ever tried to trade engulfing bars? Maybe you are currently doing so?
How has that been working out for you so far? A guess would be not so good.
There is a reason why your engulfing candle trading strategy isn’t working.
A simple but powerful truth the so-called price action authorities out there won’t tell you. A truth that reveals trading engulfing bars or any other one- or two-bar reversal pattern for that matter, not only puts you at a great disadvantage in the market, but it also has a very negative impact on your trading performance.
Now you must be asking yourself, if trading engulfing candles is a sub-optimal way of trading, why do so many price action sites and teachers market this way of trading as much as they do?
The reason behind that is very simple. The whole concept of trading simple 1- or 2-bar candlestick patterns from key support and resistance levels is very easy to understand, teach and learn. Thus, it is also very easy to market and sell to any new retail trader entering the trading arena.
Most retail traders come to the markets with unrealistic expectations and are therefore extra vulnerable to the “quick fix” trading approach these patterns offer. “Trade X, Y and Z patterns at A, B and C spots in the market and you’ll be making a lot of profit in no time.”
Other reasons this concept is so attractive for beginning retail traders is:
- a) It gives the trader a clear “signal” (reason) to enter the market which means less headache/work for the trader.
- b) It gives the trader a false sense of “confirmation”. A way of “confirming” the validity of a level creating the illusion of certainty.
This is of course a myth which we’ve discussed in earlier articles such as this one.
Keep in mind, quick and easy processes rarely lead to high quality results. More often than not, the output equals the input.
Before we go deeper into why trading engulfing bars puts you at a disadvantage in the markets, we have to give a very simple definition of the engulfing candle pattern.
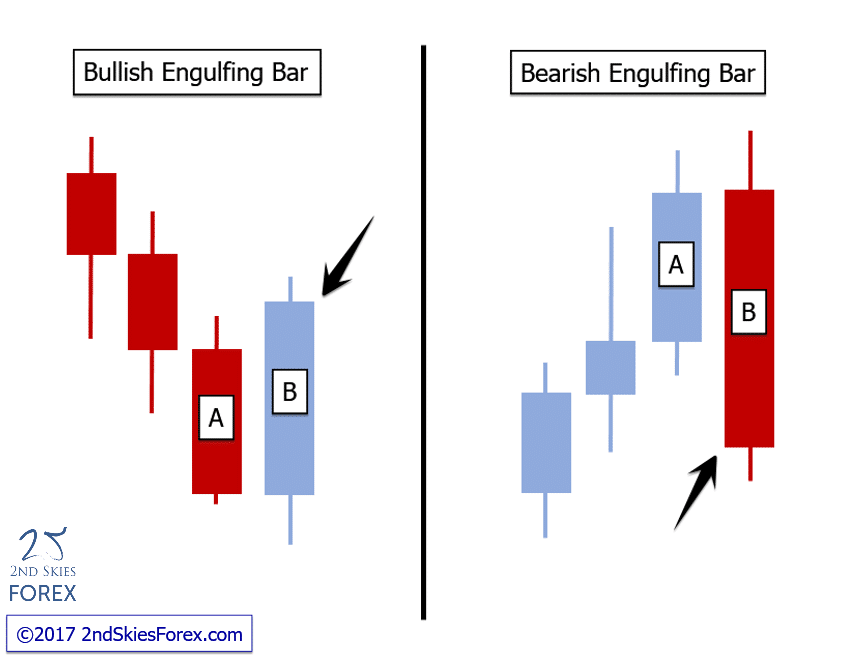
For a bearish example of an engulfing candle pattern:
The A bar is a bullish bar (bar that closed up) and the B bar is a bearish bar (bar that closed down), whereby the high of the B bar is above the high of the A bar, but the close of the B bar is below the low of the A bar. If the low of the B bar is below the low of the A bar, but closes inside the price action of the A bar, then it is an outside bar pattern which is a different reversal pattern.
For a bullish example of an engulfing candle pattern:
The A bar is a bear bar, and the B bar is a bull bar, whereby the low of the B bar is below the low of the A bar, and the close of the B bar is above the high of the A bar. If the high of the B bar is above the A bar, yet the B bar closes inside the price action of the A bar, then it would be a bullish outside bar pattern.
Below are two visual examples of Bearish and Bullish Engulfing Bars:
Now that we’ve established what an engulfing bar is, let’s take a look at why using engulfing bars as a “signal” and/or “confirmation”, is a sub-optimal way of trading and puts you at a disadvantage.
Professional traders do not trade based on any kind of 1-2 bar candlestick patterns, why should you?
There is a reason professional traders make money, whilst the majority of retail traders don’t.
It can also easily be said that when retail traders are getting in the market, professional traders are already in profit.
Why’s that?
Let’s look at an example using a chart to illustrate this.
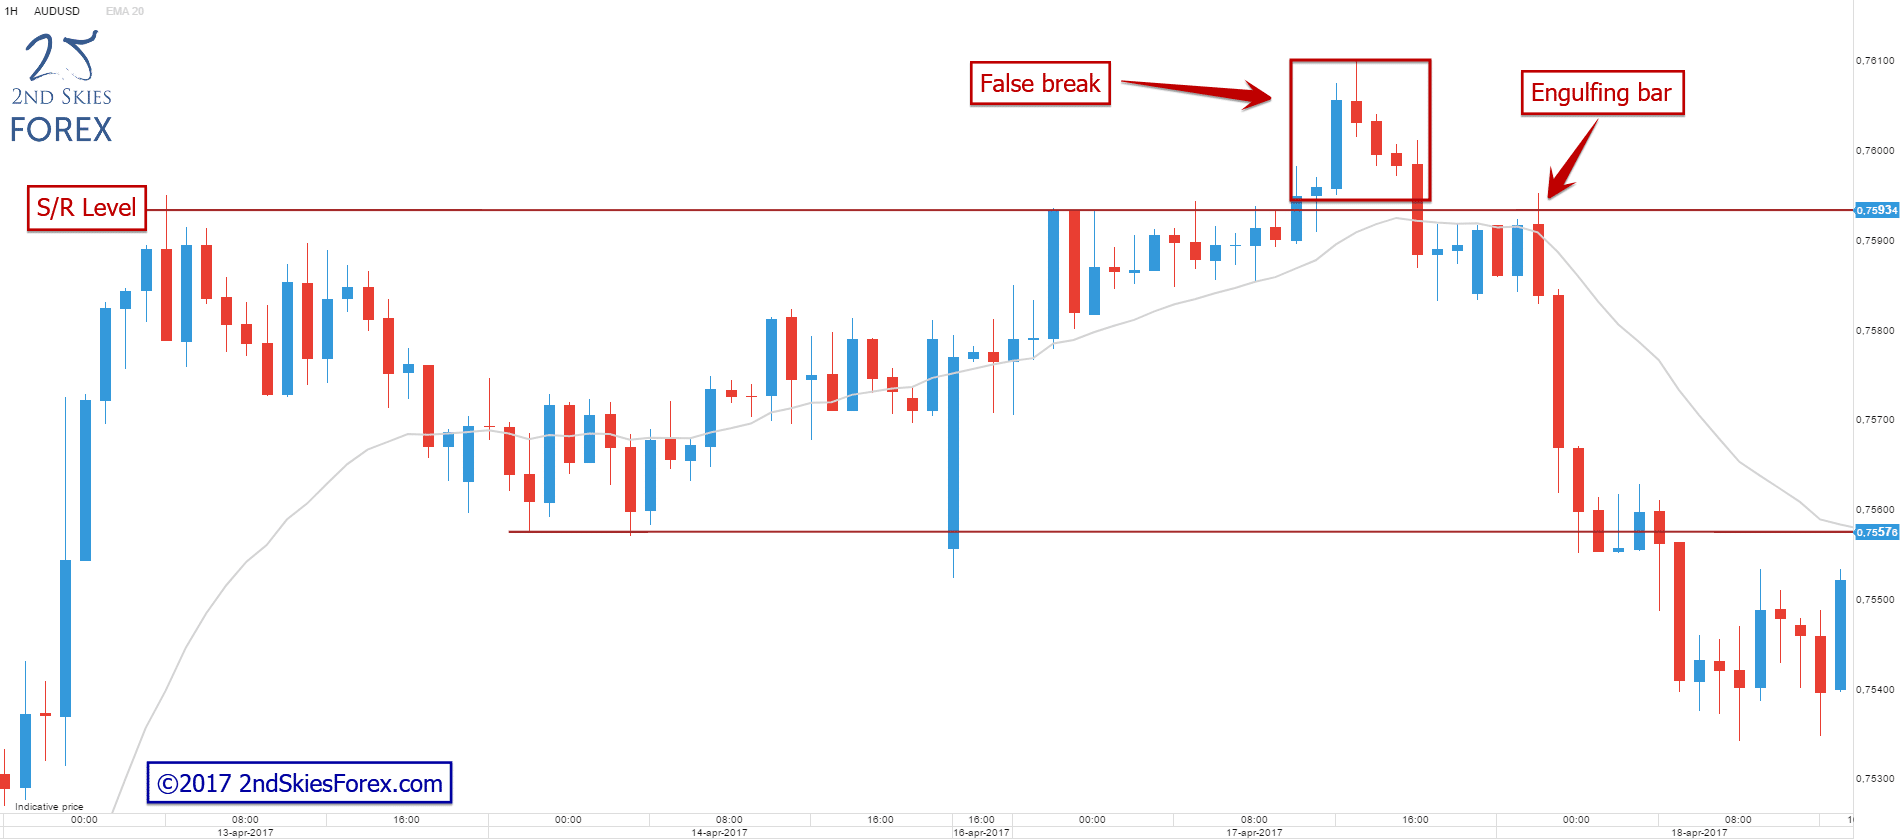
Below is a 1 hour chart of the AUD/USD in which we can see a short-term resistance level that rejected price followed by a breakout and false break. Price then came back to re-test the level again and formed an engulfing bar.
Now, there are two ways to trade these engulfing bars according to the majority of candlestick teachers/sites.
- a) Enter at the break of the low of the engulfing bar, or…
- b) enter on a 50% retracement into the bar.
Let’s assume we trade this engulfing bar the way it’s taught by most and compare both types of entries to a professional way of trading the same level. We will use the same stop loss- and target location in all three examples.
First out, the trade entering on a break of the low of the engulfing bar. The stop loss is placed at a healthy distance above the resistance level.
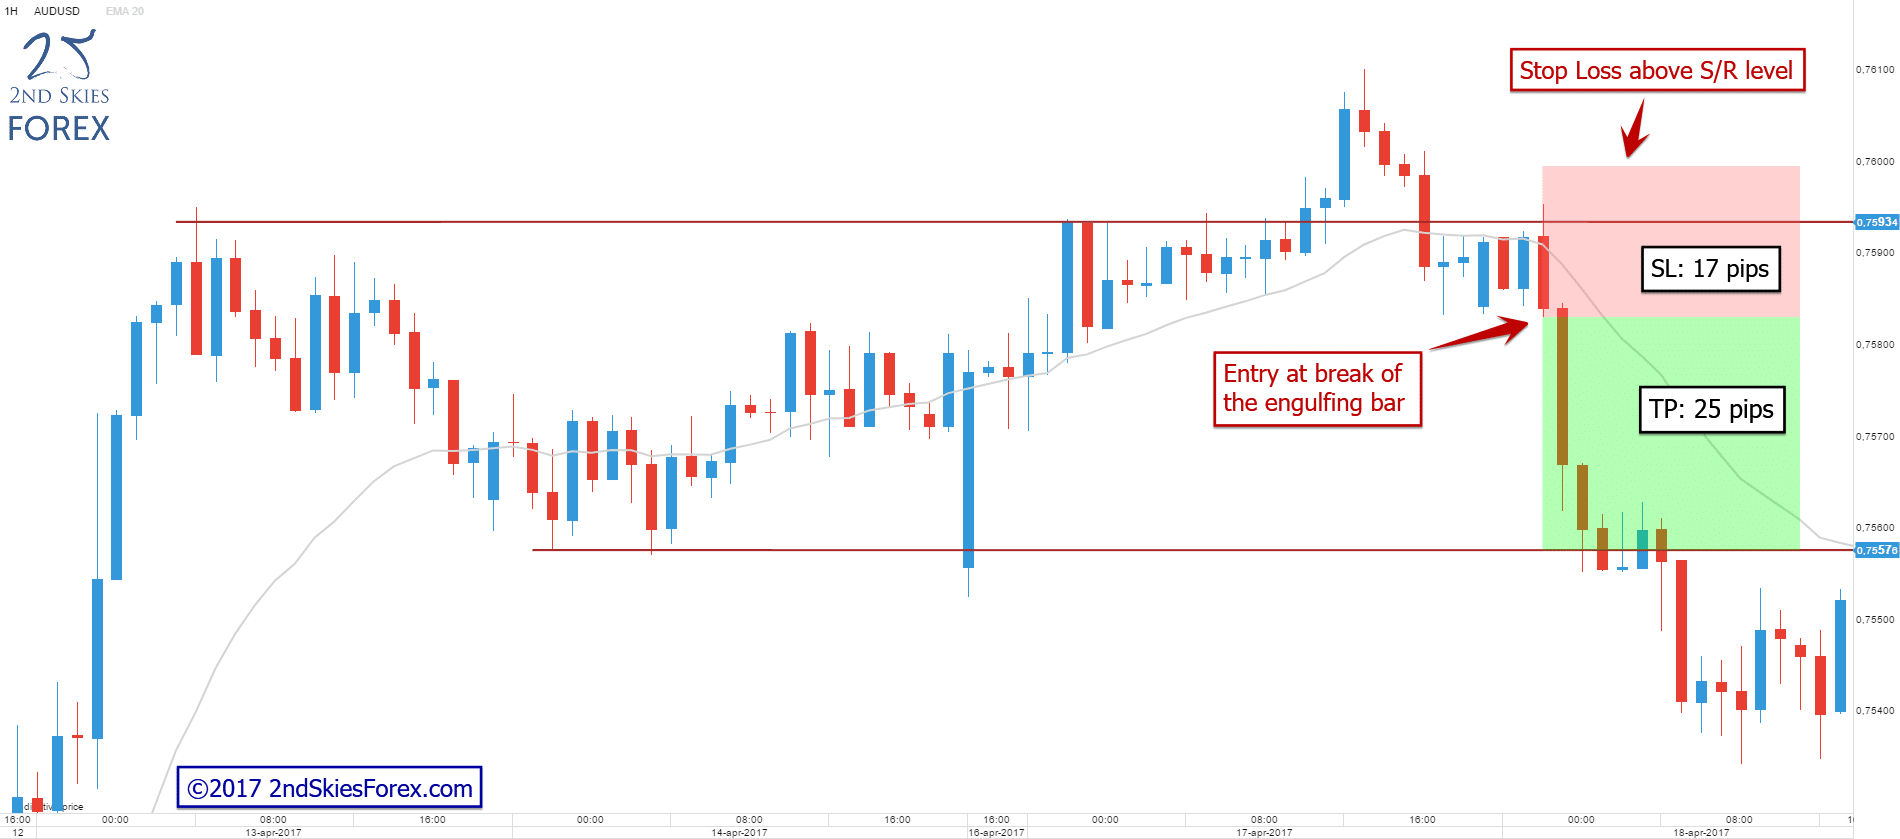
As you can see from the screenshot, this trade would have a stop loss of 17 pips and a target of 25 pips resulting in a potential +1.47R
Now, this is how a possible 50% retrace entry would have played out not changing anything but the entry location.
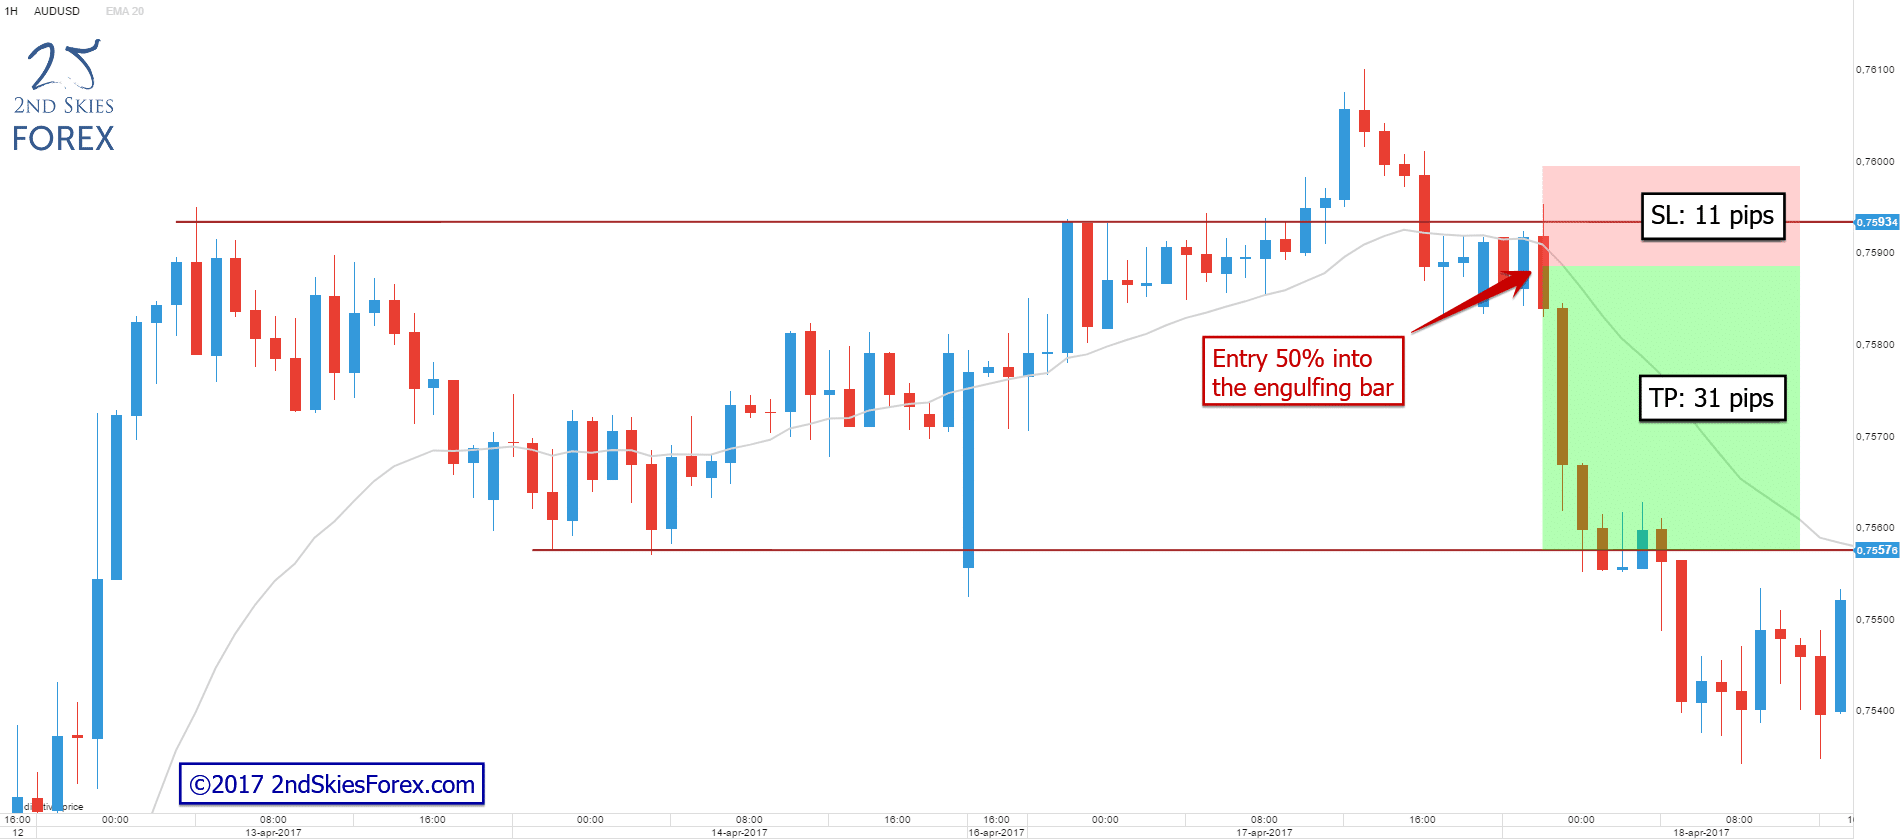
In this example price never retraced back into the bar and continued to sell off. Using this approach, we would have missed out completely on this trade opportunity.
For the sake of this comparison, let’s assume price did pull back to the 50% mark into the engulfing candle. We then would have had a stop loss of 11 pips and a target of 31 pips resulting in a risk/reward ratio of 2,81R.
Not bad, almost a 100% improvement in risk vs. reward.
Let’s compare this to taking the trade directly off the resistance level, again, leaving the stop loss and target untouched.
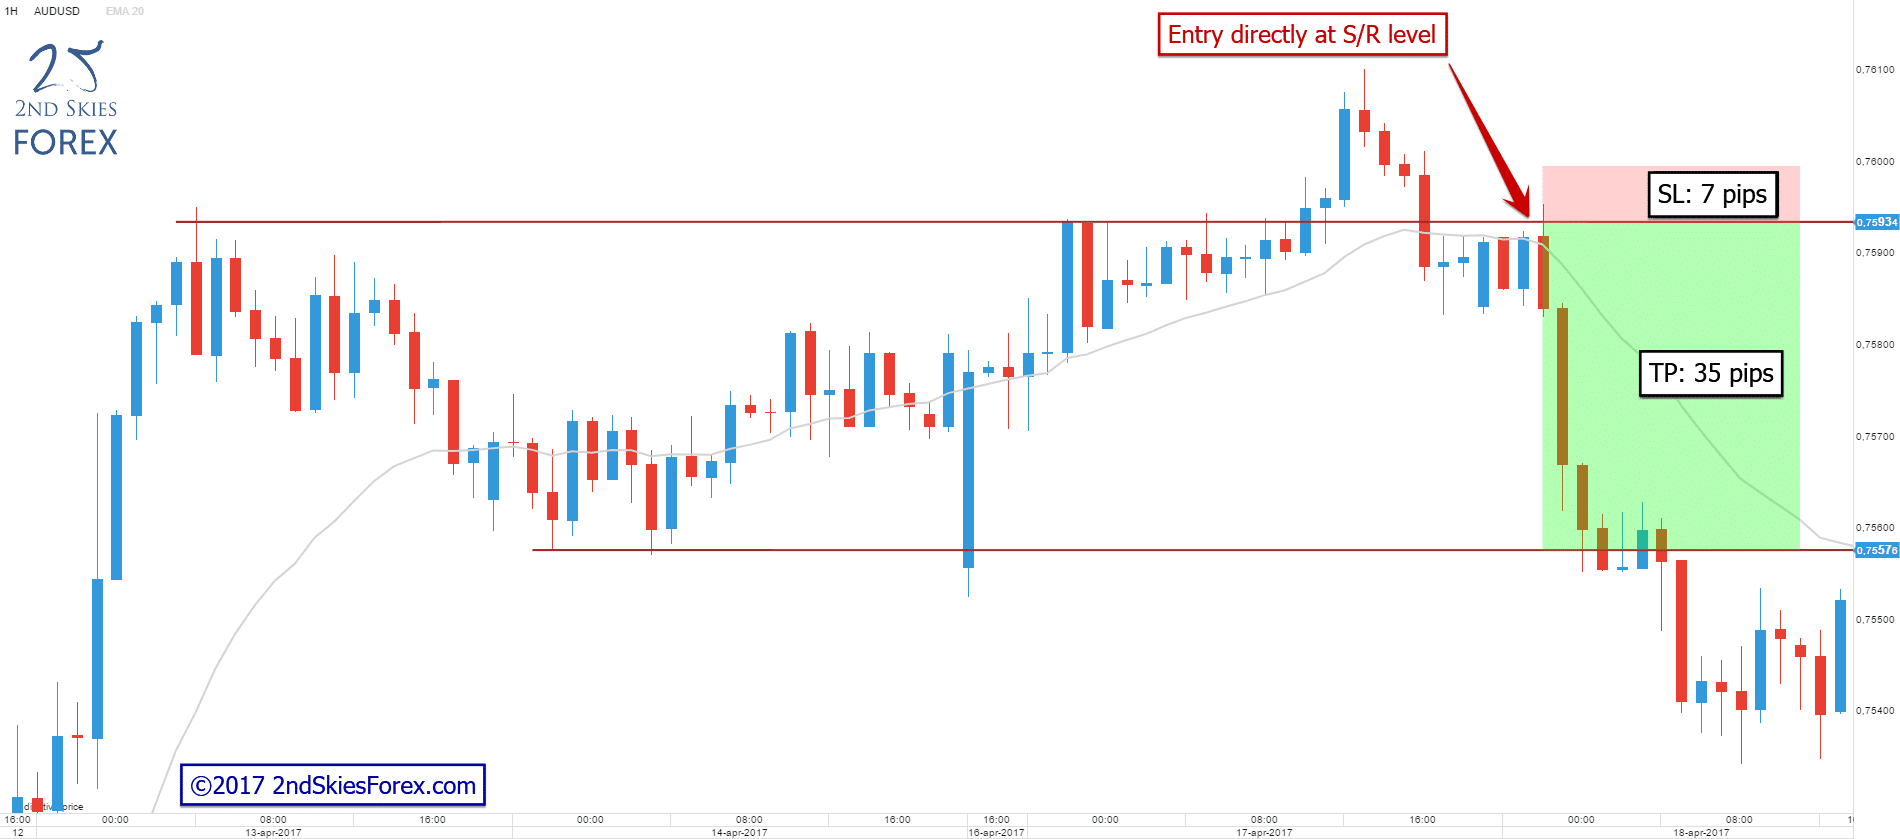
This is where it gets interesting. This trade would have had a stop loss of only 7 pips and a target of 35 pips, resulting in a risk/reward of 5R(!).
This fact alone should make you raise your eyebrows and realize that using engulfing bars as a way to enter gives you a sub-optimal entry at best.
Now, most engulfing bar traders would argue that using engulfing candles as “confirmation” of a level increases their win rate (which isn’t true!). But, for the sake of the argument let’s play with the thought that it is and give the engulfing bars a +20% higher win rate.
To be able to compare the 3 different examples above in detail, let’s put the numbers against each other over a 100-trade sample size.
Example 1 – Entry at break of engulfing bar:
Entry: 0.75830
Stop loss: 0.76000 (17 pips)
Target: 0.75580 (25 pips)
# of trades: 100
Win rate: 60%
Losing trade: -1R
Winning trade: +1,47R
Calculation: 60 x 1,47 + (40 x -1,00) = 48,2
End Result: +48.2R return over 100 trades
Example 2 – Entry at 50% retracement into EB:
Entry: 0.75890
Stop loss: 0.76000 (11 pips)
Target: 0.75580 (31 pips)
# of trades: 100
Win rate: 60%
Losing trade: -1R
Winning trade: +2,81R
Calculation: 60 x 2,81 + (40 x -1,00) = 128,6
End Result: +128.6R return over 100 trades
Example 3 – Entry at S/R level:
Entry: 0.75930
Stop loss: 0.76000 (7 pips)
Target: 0.75580 (35 pips)
# of trades: 100
Win rate: 40%
Losing trade: -1R
Winning trade: +5R
Calculation: 40 x 5 + (60 x -1,00) = 140
End Result: +140R return over 100 trades
Comparison
Entry at break of engulfing bar (win rate 60%): +48,2R
Entry at 50% retracement into engulfing bar (win rate 60%): +128,6R
Entry from S/R level (win rate 40%): +140R
These numbers should put this discussion to bed once and for all. Why?
Engulfing bars won’t increase your win rate by 20%. Even if they did, the best entry option of the two engulfing bar examples would still produce less profit compared with our entry at the level.
On top of this there are even more things to consider…
- You will not always be presented with an engulfing bar at your chosen support and resistance levels which further works against you.
- It will render you passive when perfectly good trade opportunities present themselves.
- You’ll sit there waiting for a pattern to emerge only to see the move play out in front of your eyes (a move which professional traders are profiting from).
To summarize
Using the engulfing bar “confirmation” to enter trades is a sub-optimal way of trading, working heavily against your overall trading performance by:
- Decreasing your trading opportunities drastically and reducing the number of times you can apply your edge in the market.
- Giving you a worse entry.
- Increasing the size of your SL.
- Decreasing the size of your target.
Engulfing bar traders only have one argument to counter the above. They claim that trading using engulfing bars increases their win rate and thus makes up for the drawbacks mentioned above. Even if that was true (which it is not), the so called “blind entry” still performs better as shown in our calculations above.
By looking at this objectively and comparing the numbers we can see that trading using engulfing bars is a sub-optimal way of trading. The only reason it is so widely spread throughout the retail market is because it makes trading easy, plus the “confirmation” part caters to the lack of trust beginning traders have in the markets and their own trading.
So, the differences between a professional trader’s entry and a retail entry should be very clear by now. Especially with all the other content we’ve posted before.
If you want to continue to have sub-optimal retail entries, then you can use the forex engulfing candle as tool to trade the markets.
If you on the other hand want an entry location that gives you a lot more trading opportunities along with a better overall performance, then you’ll want to adjust your trading method.
This is what we teach in our price action course. Now, if you found this article useful, please make sure to like, share and tweet it below, and we’d love to hear from you what “a-ha” moments you have from this article.
So, please come over to see more content like this on our website at 2ndskiesforex.com where all the discussion is happening and leave your comments there.
But thank you for reading this forex engulfing candle article from 2ndSkiesForex.com, where we teach you how to increase the way you trade, think and perform.”
Now that you’ve read the article and had a chance to analyze the two methods and how they perform differently, which one wins?
What do you think? Please share and comment below.

Hi, I cannot zoom the charts when clicking on them. Big image files probably missing…
Very helpful advice within this post!
I had seen a lot of information about selling/buying on a break below the engulfing bar, but now I see why this is a big rookie mistake.
much obliged to you sir
Hi chris, I understand in an uptrend The B bar does not need to open above the high of the A bar as in forex gaps dont happen but does The B bar after opening exactly at the close of The A bar need to engluf the high of the A bar? meaning if the A bar has spikes as it highs does the B bar need to engluf that after opening ?
I was just noticing a few candles on the daily after opening do not engluf the high of the A bar but straight sells down but does engluf the low of the A bar with body close Which seems to work.
Thanks
Hello Chris,
What if A bar is a bear bar after a strong uptrend and B bar is a bearish engulfing bar,satisfying all other criteria then does it still a valid one??
Thanks
Amis
Hello Amis,
An engulfing bar formation is not dependent upon what type of bar the A bar is (bear or bull, in uptrend or downtrend) for it to be an engulfing bar.
So hopefully that answers the question.
However, in my price action course, we actually have tested the difference with interesting results that we go over there.
Kind Regards,
Chris
Hi Chris,
Yeah Certainly that does
Thanks
Anis
Hi Chris,
thank you for sharing your findings with the community.
I find your webinar, as well as blog very useful.
As I am a programmer, I was meaning to do some quantitative data on my own for some time now, but never had time to do it.
I also can’t wait to enroll into your price action course.
Best regards,
Tino
Hello Tino,
Glad you enjoy the webinars and blog articles.
Yes, it really helps to see the data which totally changes one perspective – or amplifies it.
I have tons of quantitative data in the course which you just don’t find out there
so when your ready, you’ll be able to dig into all the data you can which im sure you’ll enjoy.
Looking forward to working with you.
Kind Regards
Chris
Hi Chris,
Great article as always! l’ve really been looking forward to you bringing out some quantative data on this as l like to trade this pattern but could never get the kind of back up data you produce from any other source.l’ll be reading it all with great interest and hopefully profit from it too.
Thanks again,
Michael.
Hola Mike,
Glad you liked it. I’ll be bringing out some serious data in the course for this so stay tuned.
This and outside bars which is already in there as of yesterday.
So stay tuned but glad you enjoyed it.
Kind Regards,
Chris