What You’ll Learn In This Article:
-why most online trading courses fail to give you enough data
-how we use quantitative data to improve your trading
-where we see technology being used to give you more quantitative data for your trading
When you survey most online trading courses and mentors out there today, about 97-99% of them fail to give you an essential component for your trading success. They fail to give you quantitative data to improve your trading performance.
The majority of courses just give you ‘information‘, so they give you lessons, pdf’s, videos, etc. But almost none of them actually require you to compile and build quantitative data around your trading performance to analyze it, then give recommendations based upon statistics and proper data.
To be clear, when we say ‘quantitative data‘, we are not talking about robots, quant trading, etc. We’re talking about hard data that can be taken from your trading and trading performance, which can be analyzed and utilized to identify your weak points/strengths, then make adjustments to your trading plan based upon the data.
Why Most Online Trading Courses Fail To Give You Enough Data
In my online trading courses, such as my price action course, we offer all members a free ‘Trading Analytics‘ session whereby I analyze 20+ metrics on a students trading performance to spot leaks, weaknesses, strengths, how close they are to becoming profitable, and what changes they need to make this happen. I then do a private skype session with this student and share my findings, recommendations, and what they need to change to become a profitable trader.
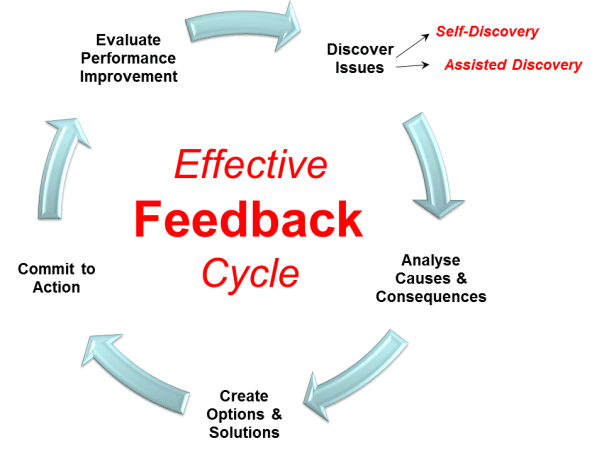
However, even I myself can find weaknesses in this model. This is because trading is a skill based endeavor which requires a proper trading feedback loop.
A feedback loop is a process whereby you perform an action (trade demo/live), your actions produce results (profits/losses/accuracy/risk, etc), and those results are analyzed and turned into feedback which is given back to the student.
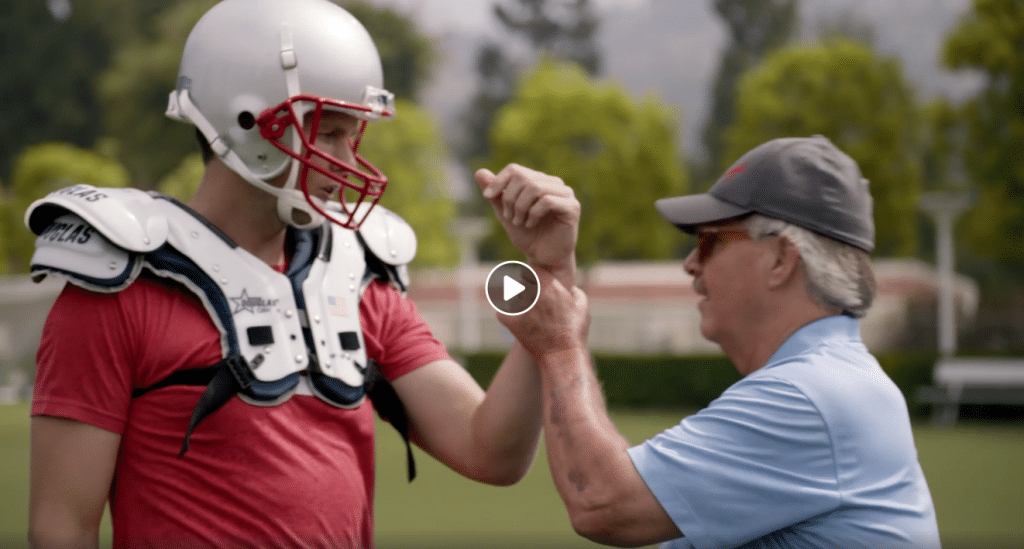
Professional athletes have proper feedback loops, and its one of the biggest reasons they are so successful. This is because they’re getting constant feedback backed by data on how they’re performing, and how they can improve. You can see this below from the Tom vs Time series.
Tom Brady of the New England Patriots is considered to be one of the greatest quarterbacks of all time. He’s won the most Super Bowls of any quarterback (5), and is still playing at an elite level at the age of 41.
In the 2nd episode called The Mental Game, Tom is getting feedback on his throwing arm about 2 minutes in.
Keep in mind, he has one of the most accurate arms in the game, and still throws the ball like he did 10 years ago. Yet he’s getting continual feedback on his throwing mechanics to continually improve them. This is a proper feedback model, and it’s something all professional athletes get and know they need to stay at the top of their game.
With that being said, why should trading be any different?
Now while my feedback loop through the trading analytics session, and analyzing students trades, questions, etc. is good, it needs to go to the next level.
All professional grade feedback loops have the following characteristics:
1) quantified
2) automatic
3) ongoing
4) responsive
5) continually updating
When I analyze my feedback loop and process for my members, I realize its not automatic, is quantified, is voluntary, is ongoing, and is continually updating.
So I’m missing the automatic and non-voluntary aspects to my trading course and feedback model.
Granted, I cannot force students to give me their data, hence making it tough to be non-voluntary. And I cannot (as of yet), make this process automatic. Hence, even my courses and feedback models have their limitations.
Regardless, if you want to become a peak performing trader, you’ll need the above 5 characteristics of a professional grade feedback loop.
How We Use Quantitative Data to Improve Your Trading Performance
One of the most critical aspects of our online trading courses is the Trading Analytics session I do with my students. It’s the first time I can look at their trading over a period of time, and analyze their risk mgmt, Avg. +$ per trade, % accuracy, risk of ruin (RoR), and many more metrics about their trading.
The majority of my students trade on platforms that connect with myfxbook, so I have them connect their accounts to myfxbook which provides me the data.
Just from looking at the data, I can see their habits, level of discipline (or lack thereof), whether they are following their trading plan, entry locations, stop loss placement, trading with trend (or counter-trend) and more.
The data alone allows me to peer into your trading performance, habits and trading mindset, all via the numbers. The great thing about it is I can tell how close someone is to breaking through and being profitable.
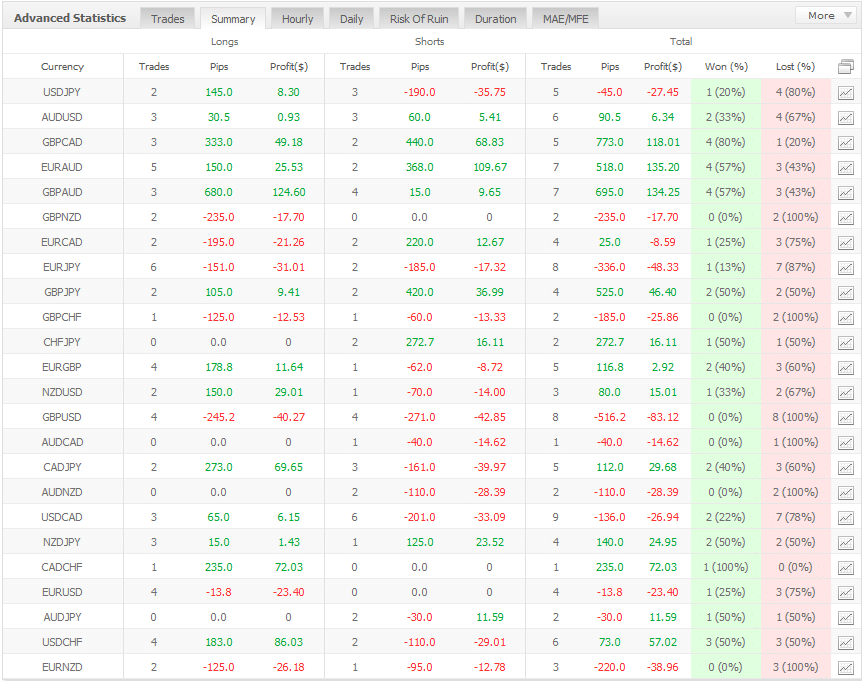
Hence we use quantitative data to improve your trading performance. One simple data point I often examine is their ‘summary‘ tab (image below).
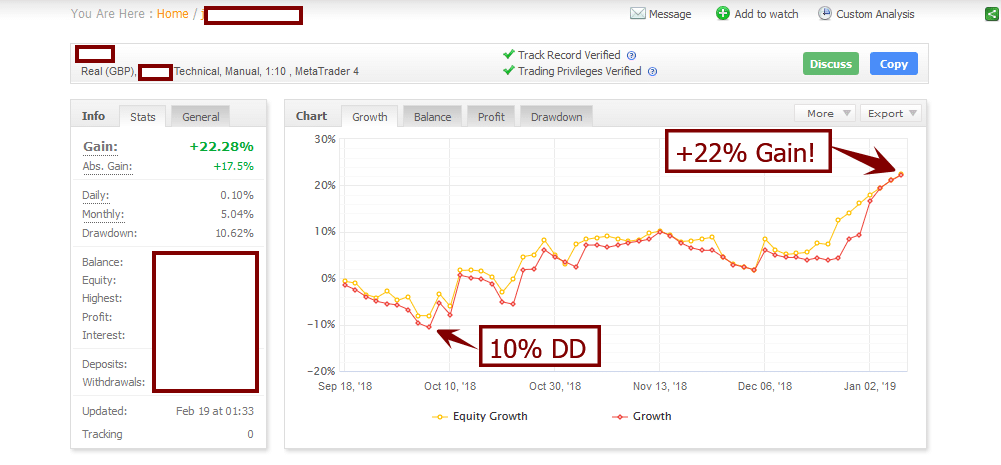
And below this is the student’s performance since the beginning of this year on a live account (over +10% profit).
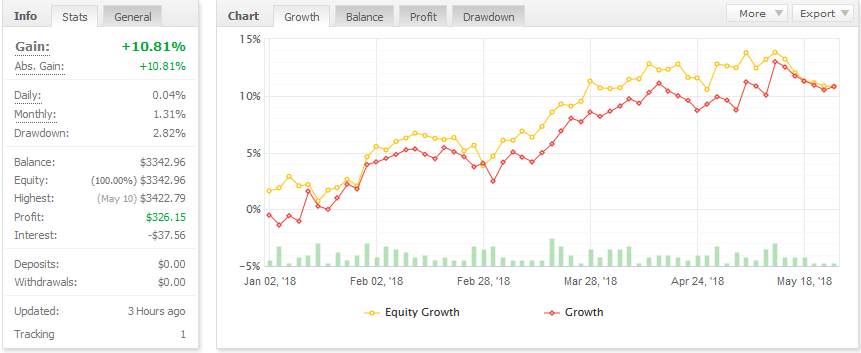
Now, when you look at the summary tab, you’ll see this traders entire performance by instrument since the beginning of this year. If you examine it closely, you should find something really useful.
This trader and student did incredibly poorly on the GBPUSD. They made a total of 8 trades (not a huge baseline by any means), and didn’t win a single trade. On top of it, their total losses for this pair alone (-$83.12) is larger than their next biggest losing pair by almost double the amount (EURJPY -$48.33).
The thing is, if you just look at the equity curve, you’d think everything was fine and there wasn’t much to change. But analyzing the data can reveal these things.
Now considering this account started at around $3000, if they had not traded this pair at all, they would be up another +5.4%, so almost a 50% increase from their +10% performance thus far. Add in the EURJPY pair, and now we’re talking an additional +8.8% added to their bottom line. That’s a huge shift in performance (+80% better return) which can make you a lot of money over time.
Most traders don’t even know this tab exists, let alone analyze it to see if there are some real under-performing instruments affecting their account. You can also take the flip side of this and trade the pairs/instruments you are most profitable with, thus maximizing your edge.
The great thing about this is it helps me find weak points and strengths within any particular trading plan, and make adjustments accordingly.
I usually follow up with my students every 3 mos and re-analyze their myfxbook accounts so I can see how their performance is changing over time as we make new recommendations.
If your trading performance is up from my recommendations, then I know we’re on the right track and can continue refining your trading plan over time. If we take a step back, then we can analyze individual variables to see which may be causing the under-performance, and make adjustments.
This is just one of 20+ metrics I analyze on all my students so we can use quantitative data to improve your trading performance.
Now ask yourself this:
If you’ve taken multiple trading courses from various forex trading mentors, how many of them are doing this type of analysis and quantitative data to isolate areas where you’re under-performing, and help you make adjustments? My guess is your answer will be close to zero, and maybe 1-2 at best.
I feel this is just a small way we continue to separate ourselves from other trading mentors, because we use actual data to analyze your performance over time, and help you make the adjustments needed to become a profitable trader.
How Technology Can Be Used To Get You Quantitative Data For Your Trading

While I think myfxbook is a fantastic tool, it is by no means sufficient. In fact, out of all the trading technological tools out there I’ve seen, I feel they are all limited in their application and what they can tell you about your trading performance, and what you need to change to make money trading.
When I look into the next evolution of trading education and online trading courses, I feel we’re just scratching the surface of how we can use technology to improve your trading performance.
What if we were to use technology to specifically test your price action trading skills over time, and demonstrate what parts of the price action you’re analyzing correctly, and missing completely?
What if we could tell you the optimal number of instruments you can trade to become profitable, and how many is too little, or too many?
What if we could tell you how you react to the price action of different instruments, and could recommend specifically which types of instruments you are most likely to make money trading (or lose money on)?
Would those be valuable tools for you to invest in? Would that be worth spending money on? My guess is yes, and we’re just scratching the surface of what technology can do to help you become a profitable trader.
My sentiments are that the future of trading education will no longer be about pdf’s, videos, and webinars, but about how we can use technology to improve your trading performance and turn you into a profitable trader.
Now Your Turn
How much quantitative data are you analyzing about your trading performance to make adjustments? Is your trading mentor even looking at your trading statistics, and giving you specific feedback based upon actual data? What ways can you see technology improving your trading performance?
Make sure to leave a comment below because I’m always looking for new ways to help more traders become profitable.