Today’s article will focus on forex trading support and resistance key levels as this seems to challenge many developing traders. Learning how to trade support and resistance key levels is critical, because in essence, this is where;
a) you will be placing your stops and targets, and
b) this is where the institutional traders are getting in
In reality, forex support and resistance trading levels are like ‘doors’ or ‘walls’, either they will be open or closed – either they will break or they will hold shut. Your success in support and resistance trading will be in determining when they will hold, and when they will break.
Thus, it becomes essential to learn how to read key levels so you can have a well defended stop, a highly efficient entry, and also have proper timing. In this resistance and support trading strategy article, I will cover two powerful tips for finding these key support and resistance levels.
#1: Minimum of Two Touches
Before you can consider a level to be used as support or resistance, you will want a minimum of two touches.
Why?
Imagine you are in a strong downtrend, and the pair rejects off a particular price heavily – perhaps via a long tailed pin bar. You have to consider, with trend traders are just going to see this as a test. The bears know there are buyers off the price where the bottom of the pin bar formed, but they are not going to give up control of the trend just from a simple pin bar.
They are going to retest this level to see if the buyers there are strong enough. If they break it, then the trend and profits will continue. If not, then they will take profit, but it’s unlikely a reversal will start immediately. A good example of this is in the chart below.
GBPUSD Daily Chart
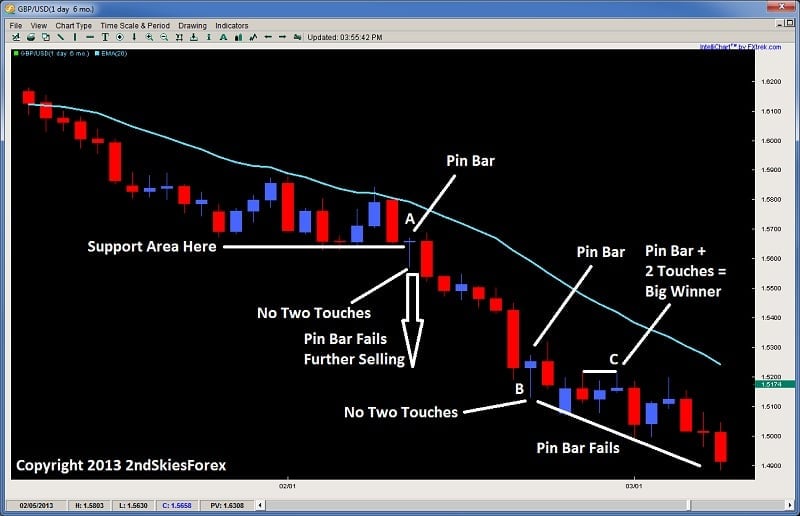
Looking at the chart above, we can see the pair is in a strong downtrend. In the middle of the chart at A, it forms a counter-trend pin bar. Now although the pin bar body is at the prior support area, the tail is way below, and its the bottom of the tail where the buyers entered in, not at the support area.
Thus, the bulls at the support area were likely stopped out when price dipped 100 pips below, & the rejection from the pin bar occurred at a place with no two touches. So this would not be a pin bar to buy as you can see failed whether or not you used a 50% retrace entry (which can be quite inefficient).
You will also see the same later on with the pin bar at B, which also had a low at no known support area or formed a second touch. This also would have been a loser.
Now notice the pin bar at C which is with trend. You will notice the pin bar formed a second touch off the level two candles back. This would have been a good price action setup to get in because the second rejection would have confirmed the level. And you will notice, it turned out to be a winner.
So the main takeaway from here is look for the two touches, because with a one touch, the with trend traders will re-attack that level. And it should be noted there is a far more efficient entry than the 50% retrace entry which I will discuss in next week’s article, but keep in mind, after long tailed pin bars, you don’t have to worry about missing the entry.
Why?
Because if it is going to reverse, the greater probability is that a re-balancing, or ‘re-distribution‘ of the order flow will begin. This mostly likely will creating a range, or a corrective pullback. This is also why when you have an impulsive price action move, followed by a corrective price action move, it is more often followed by another impulsive price action move.
This is also the reason why an impulsive price action move is rarely followed by a counter-trend impulsive price action move. From an order flow perspective, this is because if the sellers are heavily in control, the buyers will have to overwhelm the sellers, and this requires a lot more money and orders then the current bears in control. This is the reason why V-bottoms are more rare than common.
#2: Trading With Trend Increases the Probabilities
You might have noticed with the chart above, that trading with trend was more powerful than trading counter-trend. As a whole, counter-trend trades are a lesser probability trade, so they take more skill, experience, and precision. This is simply because you are trading against the majority of the order flow, so the odds are already stacked against you. For those still having trouble getting consistency, I’d recommend trading with trend as much as possible.
Now if you are in a range, then there is no dominant trend, so trading reversal type plays are suggested, particularly at the tops and bottoms of the range. But when a strong trend is in play like the one above, you will find greater profit potential and accuracy trading with trend instead of counter trend.
This also holds true for trading support and resistance levels.
Why?
In a strong trend, the larger players are just looking for key levels as areas they can get in with trend. This is traditionally known as a breakout pullback setup, and generally does not need two touches off the level to confirm its effectiveness.
Why?
Because likely, in a trend, there will be a support or resistance level that is already being challenged, which would confirm there are buyers or sellers at the level trying to defend it, while the other side is attacking it. Once it breaks, the with trend traders often look for a pullback towards this level to get back in with trend. A great example of this is in the chart below.
AUDJPY With Trend Setups 4hr Chart
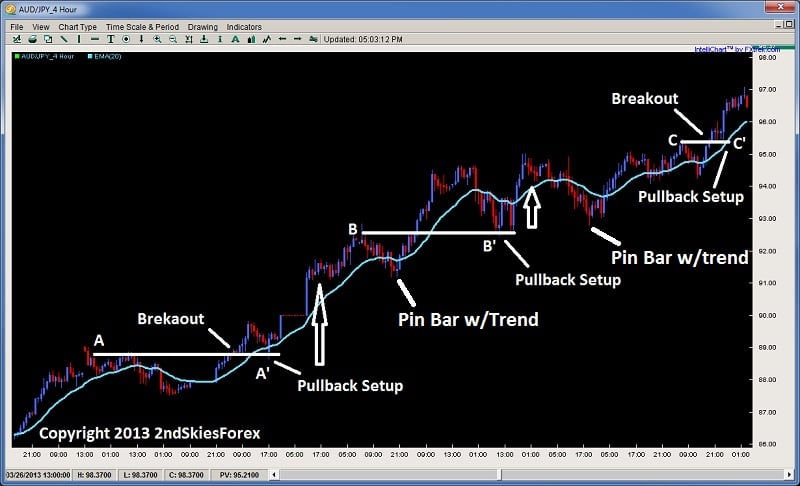
Using the chart above, starting with the bottom left, price climbs consistently, gapping up, but then forming a resistance area at A. After a brief pullback, we can see price breaks through forming a new SH (swing high). The market then pulls back to the level at A, and at A’, forms an aggressive engulfing bar which starts the next up leg for over 400+ pips before forming a pullback.
The pullback at B which forms the next resistance high, dips just below the 20ema and forms a with trend pin bar. This marks the new impulsive leg up towards 95.00. Then price pulls back towards the level at B, and at B’, double bottoms (two touches) and starts another leg up and a nice with trend entry.
After a marginal break higher, price pulls back and forms another with trend pin bar below the 20ema, which starts another up leg towards a resistance at C. Sellers enter at C, and after a short pullback, break above it, with a brief consolidation at C’, offering a great breakout pullback setup to get in with trend.
Keep in mind, in all of these with trend pullbacks, the market pulled back towards the levle that it hat the strongest rejection from at A, B and C. The strong rejections at those levels are counter-trend players, trying to stop the trend. But when the bears tried to get past the last major resistance, now turned support (forming a role reversal level), the bulls used this as an opportunity to get long.
Yet in almost every case where the market formed a resistance, when the market attacked that level again, the sellers failed to hold the level. This is because they were going against the major order flow, which highlights how much easier it is to find key support and resistance levels that work when you are trading with trend, and not counter trend. So hopefully this highlights the difference.
In Summary
Finding key levels, and major support and resistance trading levels is not some Da Vinci code type endeavor. Two key things which really help this are using the two touch rule, along with trading more with trend than counter trend. Of course, there are other key clues to understanding support and resistance, but if you can employ these two techniques, they will greatly enhance your ability to find key levels, and make highly effective trades around them.
Two very simple yet incredibly powerful tips.
Thanks Chris
Hello Clinton,
Glad you liked the article and tips as its a critical subject for trading price action.
Kind Regards,
Chris Capre
Concise and well explained, you stated it right, this is a skill which ought to be mastered by serious traders, it takes a while to develop a good and practical enough understanding, yet it is worth it, I also base my main strategy on the analysis of support and resistance, but thank you for the great article.
Hello Eric,
Yes, S/R levels are critical to trading successfully, but glad you like the article.
Kind Regards,
Chris Capre
When can I buy your book and whats cost?
Hello Dave,
It will not be ready till the end of the year.
Stay tuned to the site for details.
Kind Regards,
Chris Capre
Thanks for cranking out good stuff every week.. love the read and just wanted say I appreciate what you do.
Hello Jewell,
thanks for the positive comments and I hope the content helps others become better traders
Kind Regards,
Chris Capre
Chris, your articles are golden. Thank you
Hello Desiree,
Am glad you are enjoying the articles.
Kind Regards,
Chris Capre
Hello Chris!
I Like the way you analyze the price-action, spot on as always.
Hugo
Hello Hugo,
Glad you like the way I approach price action which I like to think is unique.
Kind Regards,
Chris Capre
Thanks Chris
Hello Max,
Glad you liked the article.
Kind Regards,
Chris Capre
Hi Chris,
I’m testing a few demo accounts from different brokers and find that the price action bars shown on chart are a bit different from each brokers. For example, broker A chart is showing a pin bar but broker B one is a just a normal bar. It’s confusing to my price action setup and study. Do you have any recommendation on how to obtain a more accurate real time chart?
Thanks and regards,
Hoh
Hello Hoh,
There is no one ‘real accurate’ chart that is the ‘correct’ chart to depict price action. There are several options, such as GMT 00.00 open for the daily close, NY 5pm EST close, and NY 00.00 close.
All can work effectively, and have their advantages and disadvantages.
Between all the options, I recommend the first two, but the last one works as well.
Hope this helps.
Kind Regards,
Chris Capre
Wow! Another Master that I must follow.
Thank you for your free article.
Unfortunately I’m in a developing country where paying online like Paypal or credit card is difficult.
Hello Vongsouk,
Glad you liked the article.
You can email me via the Contact Page for other payment options.
Kind Regards,
Chris Capre
Amazing article Chris. This completely clears up the issue I had with my last couple pin bars.
Hello Nick,
Am glad this helped and hope this helps you with future pin bar trading.
Kind Regards,
Chris Capre
Hi Chris,
This is a very useful article.
Hello Mukhriz,
Thanks mate – glad you liked it.
Kind Regards,
Chris Capre