Chris Capre’s live open price action and ichimoku trades: GBPUSD, NZDJPY, USDJPY, USDNOK, CAC40, VIX
New to Forex? Then check out my FREE Learn Forex Trading Course with videos, quizzes and downloadable resources
How Much Should You Risk Per Trade? Watch our latest video How Much Should You Risk Per Trade {3 Rules}
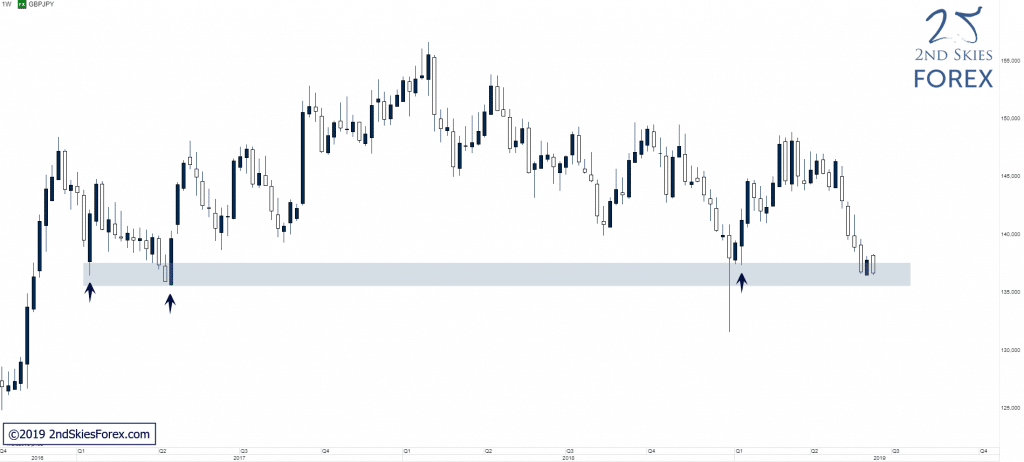
GBPJPY – Testing Multi-Year Support (Weekly chart)
Price Action Context
After breaking below 140.00, the strong selling continued and the pair is now testing a multi-year support zone at which I think at least a solid ST bounce is likely considering the significance of this support zone.
Trending Analysis
If bulls are able to successfully defend this key support, a move back up towards 140 is likely IMO and should 140 fail to stop price, 148 would be the next key resistance to look out for. A failure of this support on the other hand would open up a solid amount of downside with 130 being the first support in line to look out for.
Key Support & Resistance Zones
R: 138.60 – 140.00
S: 135.50 – 137.50
******
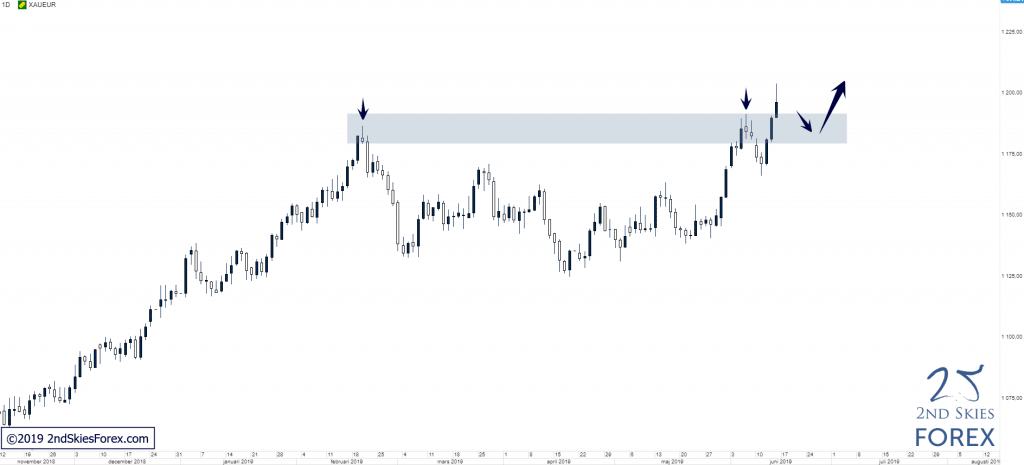
XAUEUR – Broken Above Key Resistance, Potential False Break (Daily chart)
Price Action Context
After a brief rejection at the KSP from February, the precious metal found support at 1 170 and impulsively broke above 1 190, producing a solid bullish close above the resistance.
Trending Analysis
LT bias is bullish and weak pullbacks towards the broken resistance can present potential buying opportunities. A break and close back below 1 180 would render this a CT FB and initially open up for a move back down to 1 135.
Key Support & Resistance Zones
R: 1 215 – 1 225
S: 1 180 – 1 190
******
DAX – Holding Above ST RRL (1h chart)
Price Action Context
After putting in a WT false break at 11 850, which we talked about in our commentary on the 8th of June, price continued trading higher and is currently holding above a ST RRL.
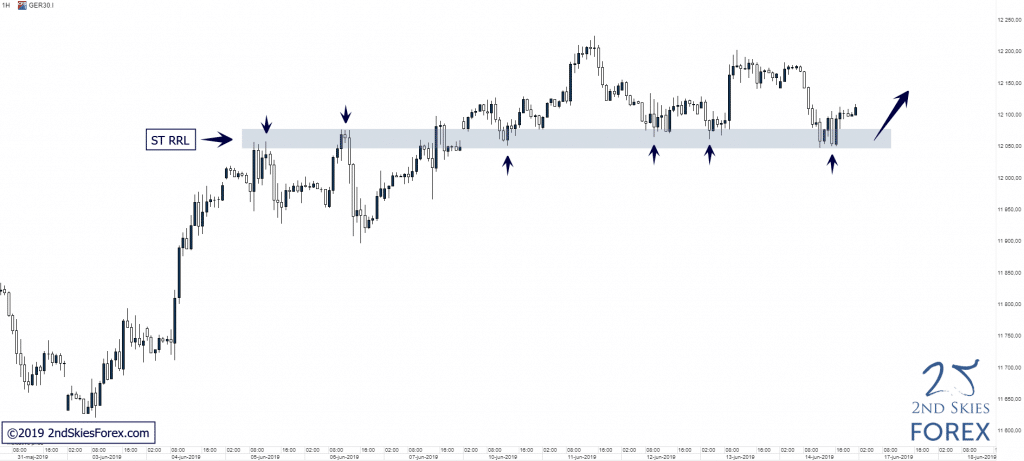
Trending Analysis
LT bullish bias and bulls can look for possible buying opportunities around the ST support level. A break below this ST support would open up for a move lower back into 11 850 which in turn also could present potential buying opportunities IMO.
Key Support & Resistance Zones
R: 12 173 – 12 225
S: 12 045 – 12 080