Chris Capre’s current live open price action and ichimoku trades: USDMXN, VIX, CAMP, EA
New to Forex? Then check out my FREE Learn Forex Trading Course with videos, quizzes and downloadable resources
Want to learn how to draw support and resistance? Check out my latest video How To Draw Support & Resistance (5 Tips)
EURGBP – Running Into Major Resistance (Weekly chart)
Price Action Context
After a failed bearish continuation + false break back above LT support in May, the strong MT bull run that followed has taken the pair all the way back up to a major LT resistance that has held since Q3 2017.
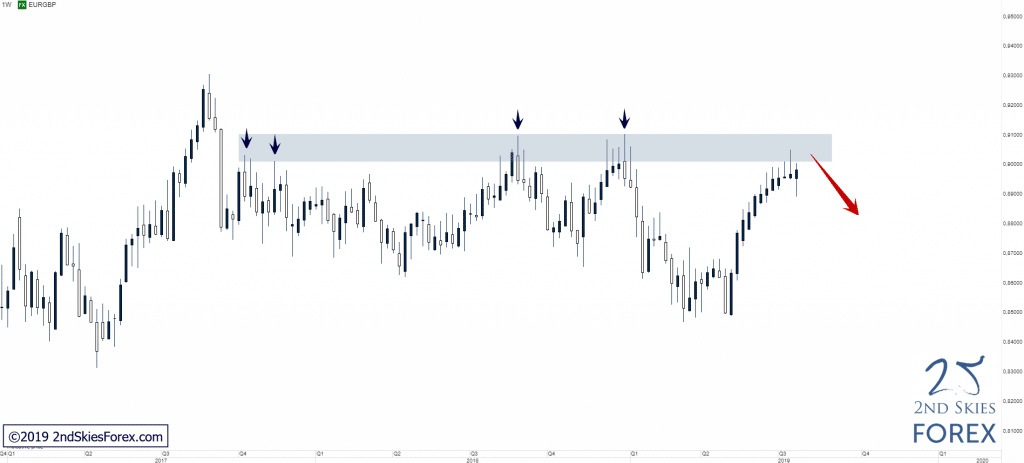
Trending Analysis
Overall neutral bias with the LT resistance offering potential bearish plays with 0.8710 being the closest LT support to look out for. A break above 0.9100 would technically open up for a continuation towards 0.9300.
Key Support & Resistance Zones
R: 0.9000 – 0.9100
S: 0.8620 – 0.8710
Stay tuned to our members market commentary for updates.
******
GBPUSD – Attempting To Break Key Support (Daily chart)
Price Action Context
After being rejected twice from 1.3300 in Feb/Mar, price sold off towards the lows created in 2016/2017. Bulls seem to be absent and unless they step in soon, it’s like this key support zone will fail to hold IMO as price action is looking very weak atm.
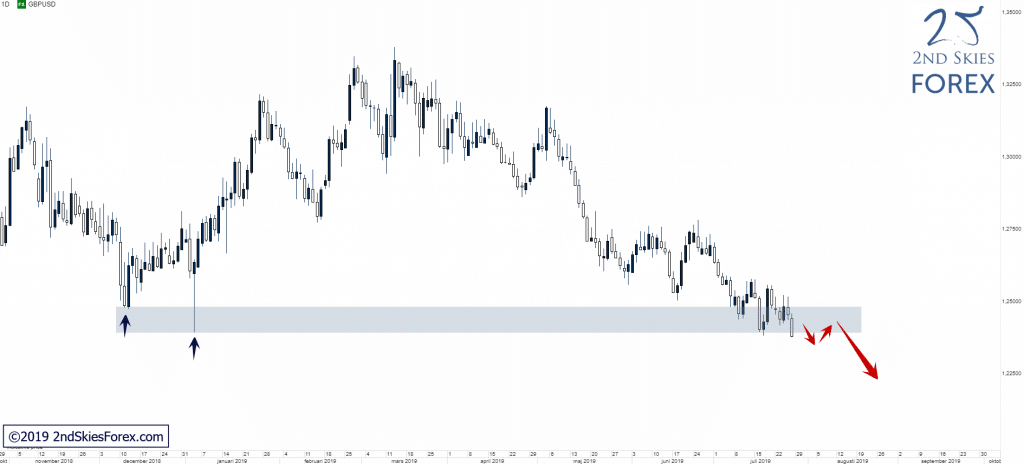
Trending Analysis
LT bias is bearish and a strong break and close below this key support level opens up for a likely bearish continuation towards the 2016/2017 lows and can offer potential short plays for bears.
Key Support & Resistance Zones
R: 1.3300 – 1.3385
S: 1.2400 – 1.2485
******
XPTUSD – Back @ LT Key Resistance (Weekly chart)
Price Action Context
After reversing a bit shy of the LT support zone, Platinum is now back at the LT resistance which has rejected price multiple times since mid-2018.
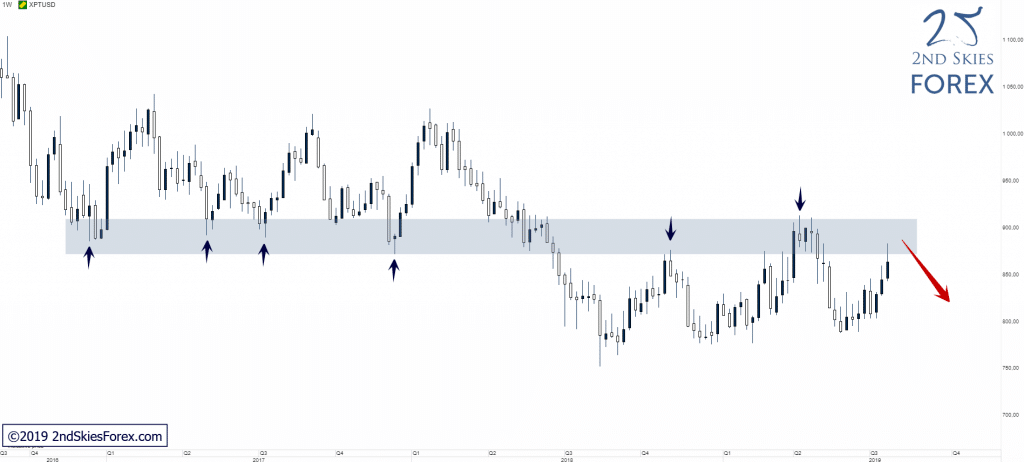
Trending Analysis
LT bias is bearish and if bears successfully can defend this zone a move back down towards the LT support is likely. A strong break and close above this zone on the other hand would put 1 010 back into focus.
Key Support & Resistance Zones
R: 870 – 915 S: 754 – 777