Chris Capre’s current live open price action & ichimoku trades: USDMXN, EURRUB, EURMXN, BIG, SIG, DIS
New to Forex? Then check out my FREE Learn Forex Trading Course with videos, quizzes and downloadable resources
Top Trade Review: Watch this live trade review of my student banking +115 pips of PROFIT & +11R on the USDJPY
Forex Trade Idea: EURMXN – Impulsive Selling At Resistance, Staying Bearish (4hr chart)
Price Action Context
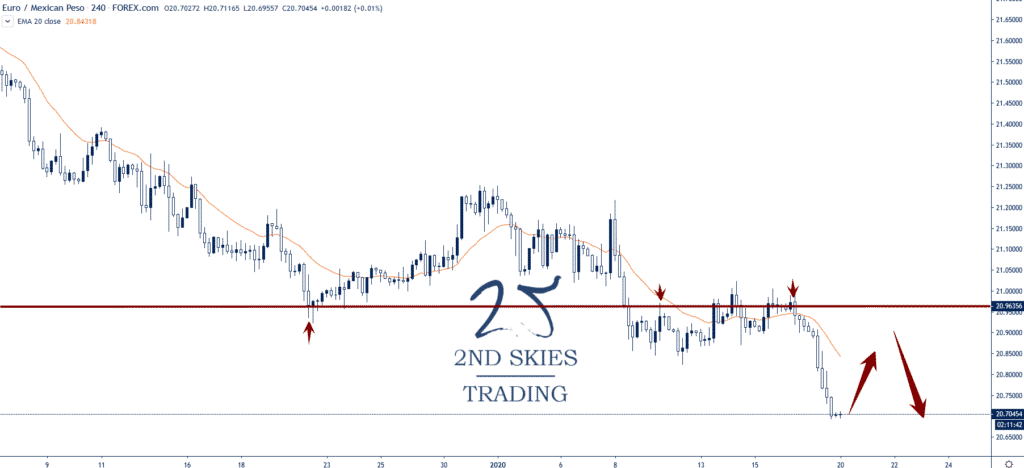
Continuing with the bear trend, the EURMXN had found some minor support around 20.96 which mostly mounted a small corrective pullback up to 21.25.
This was followed by more selling which broke below the prior support.
Notice how the corrective pullback really struggled at the 20.96 resistance level which led to impulsive selling price action.
This tells me the bears are still in control so I’m looking to add to my shorts by watching for a corrective pullback into resistance to trade with the trend.
Trending Analysis
Bearish ST and MT so am staying bearish until we get a weekly close above the 21.30 level on a weekly closing basis.
Key Support & Resistance Levels
R: 20.96, 21.25
S: 20.12, 19.03
Stay apprised with our members market commentary for updates.
******
Index Trade Idea: Stoxx 600 – Breakout In Play, Looking To Buy Pullback (daily chart)
Price Action Context
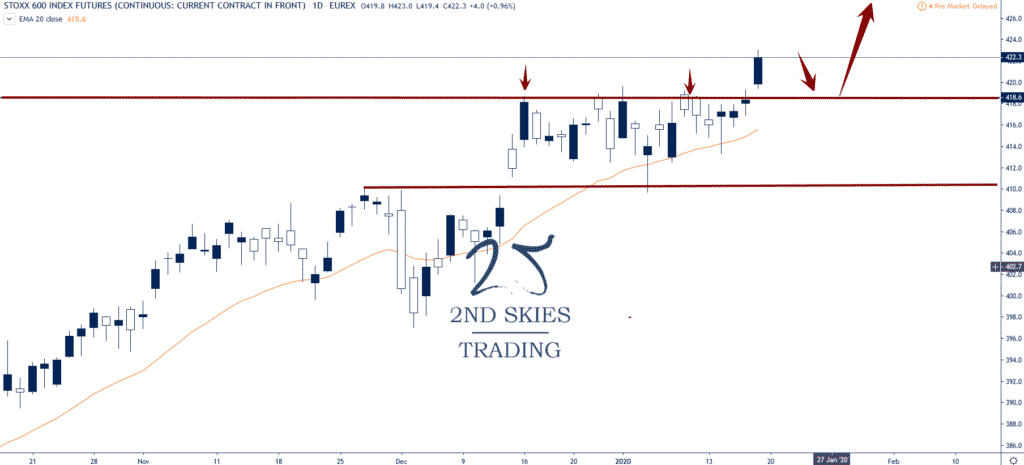
In our top trades for 2020, we talked about the Euro Stoxx 600 being bullish and looking to buy on a pullback into support around 412.
The index has done exactly that, launching higher and forming a breakout setup which has cleared the 2019 all time highs in 418 and is now holding well above it.
I’m expecting this price action to continue so am looking to get long on a pullback into support.
Trending Analysis
ST & MT bullish and looking to stay long till we get a weekly close below 408.
Key Support & Resistance Zones
R: 450, 500
S: 418, 410
******
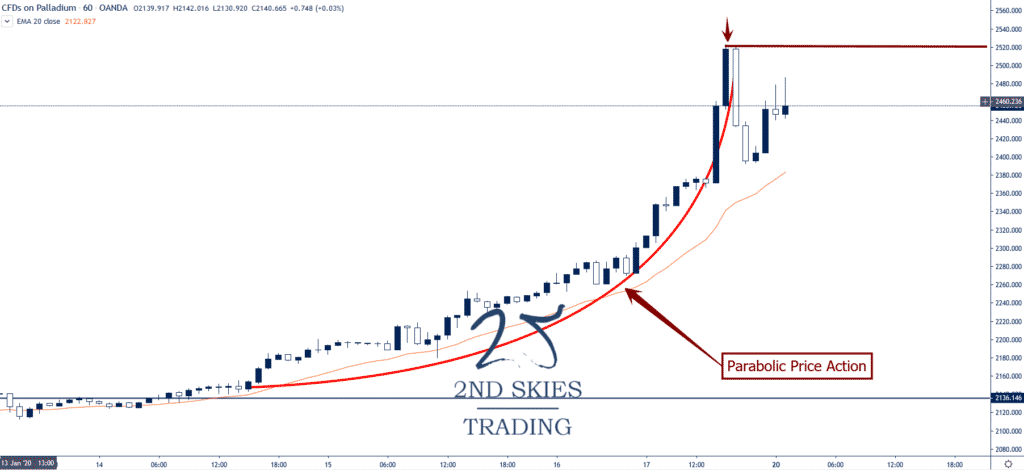
Commodity Trade Idea: XPDUSD (Palladium) – Parabolic Price Action, Watching Resistance (1hr chart)
Price Action Context
As we commented about on our youtube channel, Palladium has gone parabolic to end last week, going from 2136 on the 15th skyrocketing up to 2520 by the 17th.
If you look at the curvature in the price action, it went parabolic, which suggests possible exhaustion.
The PM pulled back sharply to end last week almost closing below 2400.
Trending Analysis
MT bullish but ST we need to clear the parabolic highs above 2520 to keep the bull trend going. Otherwise this level will act as resistance.
Key Support & Resistance Levels
R: 2520, 2600
S: 2394, 2136