Chris current open positions: EURUSD, GBPUSD, USDJPY, USDMXN, BIR, TL
NOTE: Not sure what to work on as a trader to get better, or how to progress? Read my latest article The 4 Stages of To Becoming A Millionaire Trader
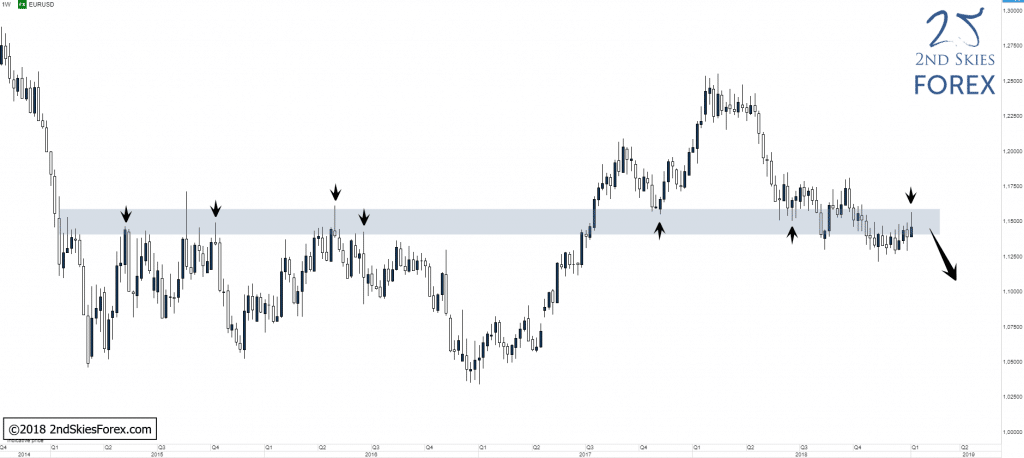
EURUSD – Holding Below Multi-Year S/R Zone (Weekly chart)
Price Action Context
Long term, not much has changes since we covered the LT context on this pair on the 18th of November last year . Price did break out to the upside of the MT corrective structure we mentioned on the 8th of January, pushed deeper into the LT resistance, only to get rejected heavily within the LT resistance, with price quickly selling off 100 pips again before markets closed for the week.
Trending Analysis
LT bias is bearish and bears can look for possible trading locations around the LT resistance, alternatively look out for potential LTF structures and/or reversals forming that can be used to get involved in a likely move lower.
Key Support & Resistance Zones
R: 1.1400 – 1.1580
S: 1.0350 – 1.0530
Stay tuned with our members market commentary for updates.
******
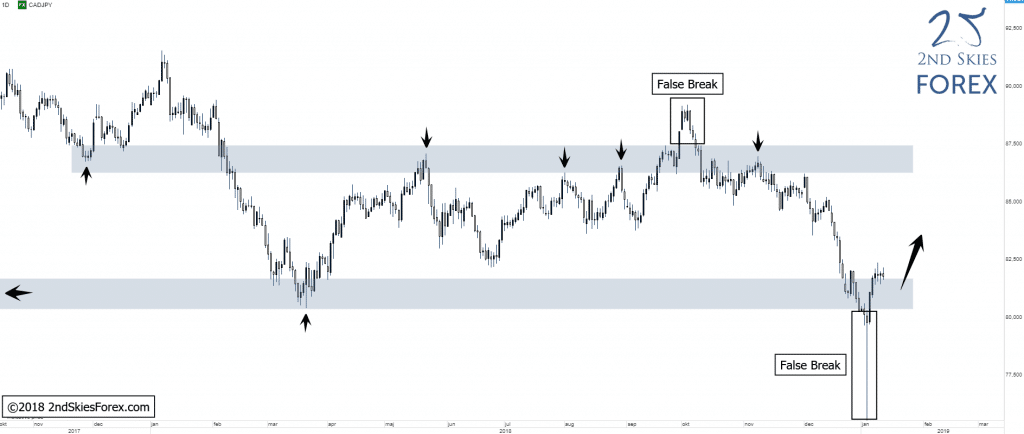
CADJPY – Massive False Break @ Key Support (Daily chart)
Price Action Context
The recent flash crash across currencies took the pair all the way down to 75.00 and a major multi-year support at which price got heavily rejected, taking price back above the LT key support level again which goes back to early 2017.
Trending Analysis
LT bias is neutral at this point IMO with the LT support offering potential buying opportunities to get involved in a likely move higher towards 87.00.
Key Support & Resistance Zones
R: 86.30 – 87.40
S: 80.40 – 81.70
******
CAC40 – Pulling Back Towards Broken LT Support, Now Resistance (Weekly chart)
Price Action Context
The multi-year support ultimately failed as more bears piled in, taking the index to prices not seen since late 2016 and over the last three weeks, price has been in a CT corrective pullback, heading towards the broken support zone which now should act as resistance.
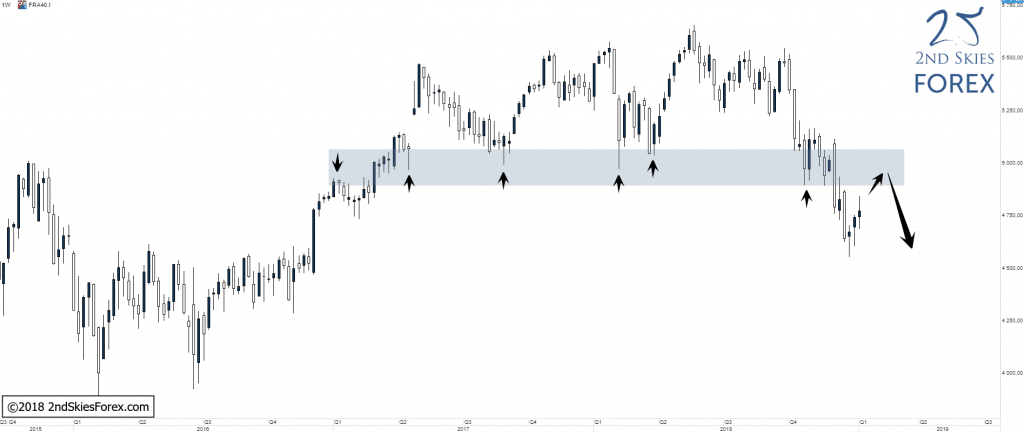
Trending Analysis
LT bias is bearish and sellers can look for potential shorting opportunities on pullbacks into the resistance.
Key Support & Resistance Zones
R: 4 900 – 5 070
S: 3 800 – 4 070