Chris Capre’s current live open price action & ichimoku trades: USDMXN, EURRUB, EURMXN, BIG, DIS, AC, ISD
New to Forex? Then check out my FREE Learn Forex Trading Course with videos, quizzes and downloadable resources
Top Trade Review: Check out our latest Top Forex Trade Review with my student banking +158 Pips on the EURCHF nailing a PERFECT ENTRY!
Forex Trade Idea: GBPJPY – Buy & Sell Setups Available (daily chart)
Price Action Context
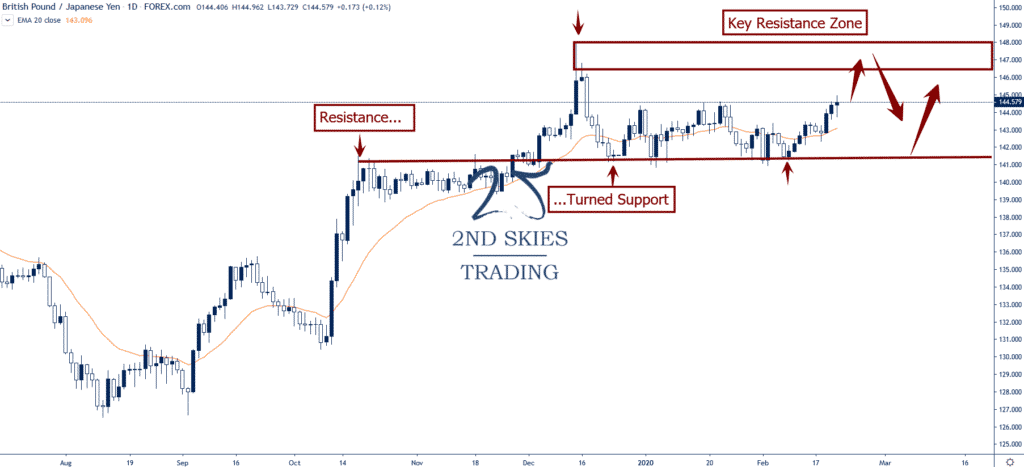
For all of 2020, the GBPJPY forex pair has been stuck in a 325 pip range between 141.25 and 144.50.
The pair however has gained 7 of the last 10 days, and is making an earnest attempt to break the yearly highs.
Doing so would put key resistance zone between 146.60 and 148 into play where likely profit taking will emerge, along with some sellers.
Meanwhile a failure to break the yearly highs would likely put 143 and 141.25 into focus.
Trending Analysis
ST & MT neutral while inside the 325 pip range. Watch break for next technical direction.
Key Support & Resistance Levels
R: 146.60, 148
S: 141.25, 139.45
Stay tuned with our members market commentary for updates.
******
Commodity Trade Idea: XPDUSD (Palladium) – Makes New Yearly Highs, Lifts Support Zone (4hr chart)
Price Action Context
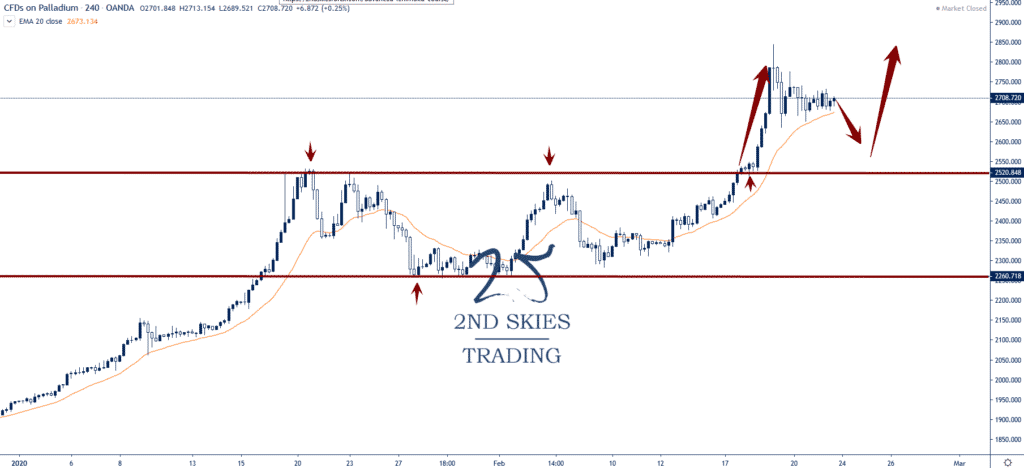
After going gang-busters to start the year, climbing from sub 2K to 2520 last month, Palladium formed a large corrective structure for about a month.
That structure just got annihilated as the precious metal broke through the 2520 resistance ramping up to 2545 in a couple days.
Since then the PM has consolidated its gains while tidily holding above the 4hr 20 EMA (chart below).
Trending Analysis
I’m bullish on Palladium till we get a weekly close below 2500. I’m watching for corrective pullbacks towards support to get long.
Key Support & Resistance Levels
R: 2845, 3000
S: 2520, 2260
******
Crypto Trade Idea: Bitcoin (BTCUSD) – Looking to Buy On A Pullback (daily chart)
Price Action Context
Bitcoin has had a pretty solid start to the year, up +30% on the year.
You’ll notice the strong momentum on the daily chart below in how the price action maintained its bullish position above the 20 ema.
Recently however, the cryptocurrency has played on both sides of the 20 EMA, suggesting the momentum short term is weakening.
To me, the overall bull trend to start the year is in place, but may be taking a pause.
I’m looking to buy a pullback into support with the first potential level being the role reversal level around 9060.
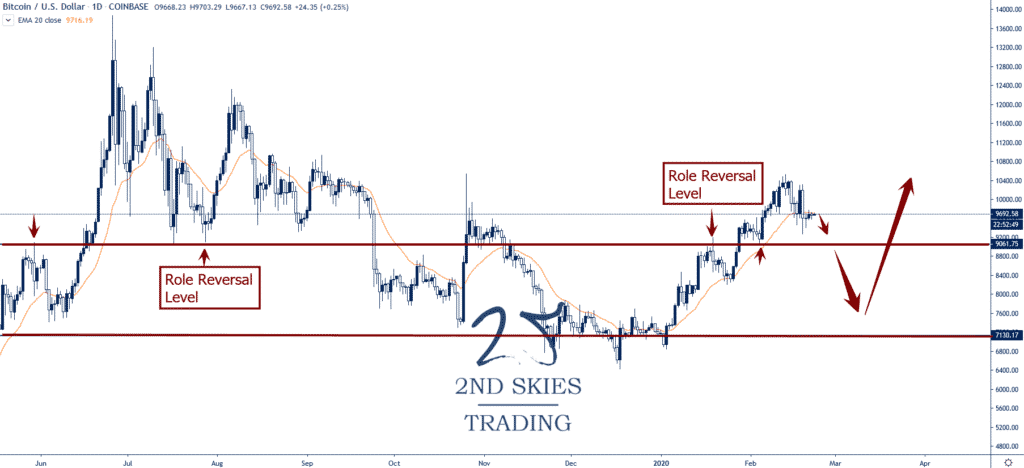
Trending Analysis
ST neutral but MT bullish while above 7250 on a weekly closing basis.
Key Support & Resistance Levels
R: 10450, 12000
S: 9060, 7130/7250
******