Chris Capre’s current live open price action and ichimoku trades: USDJPY, AUDCAD, SLV, AUS200
New to Forex? Then check out my FREE Learn Forex Trading Course with videos, quizzes and downloadable resources
What is happening in the forex market? Check out my latest video on how this unique volatility environment will affect your forex trading
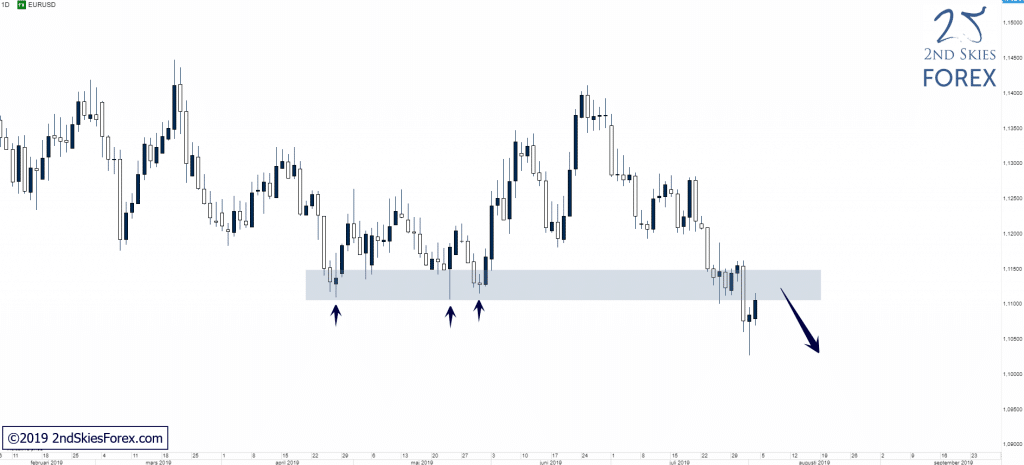
EURUSD – Broken Below MT Support (Daily chart)
Price Action Context
After bulls got rejected around 1.14 in the end of June sellers re-took control and EURUSD has now broken below a key support zone and produced a new lower low MT, opening up for a likely continuation lower towards 1.09 if bears are able to stay in control.
Trending Analysis
Bias is bearish and the current pullback into the broken support which now should act as resistance can be of potential interest to bears looking to short the pair.
Key Support & Resistance Zones
R: 1.1100 – 1.1150
S: 1.0800 – 1.0900
Stay tuned to our members private trade setups channel for updates.
******
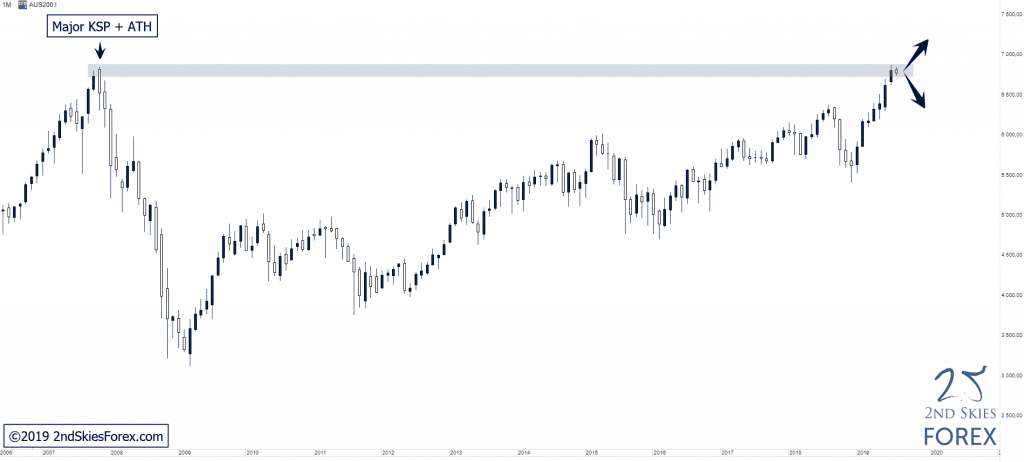
ASX – Testing Major Resistance & ATH (Monthly chart)
Price Action Context
Australia’s index is now testing the ATH resistance zone from the pre-financial crisis high back in 2007, something we highlighted as a possibility in our top trade ideas for 2019 video.
Trending Analysis
LT bias is bullish, but considering the significance of this ATH, at a minimum, a solid bearish ST rejection from this key resistance is very likely IMO, which can present potential shorting opportunities to bears. A LT break and close above 6880 would open up further upside for the index.
Key Support & Resistance Zones
R: 6780 – 6880
S: 6330 – 6450
You can trade the ASX200 index via our preferred trading broker here.
******
XAUUSD – MT With-Trend Corrective Structure Above LT Key Support (4h chart)
Price Action Context
Mid-June, the precious metal successfully cleared the multi-year resistance we’ve mentioned in our recent member market commentaries, opening up further upside. Since, price has produced a MT with-trend corrective structure which for now seems to be holding.
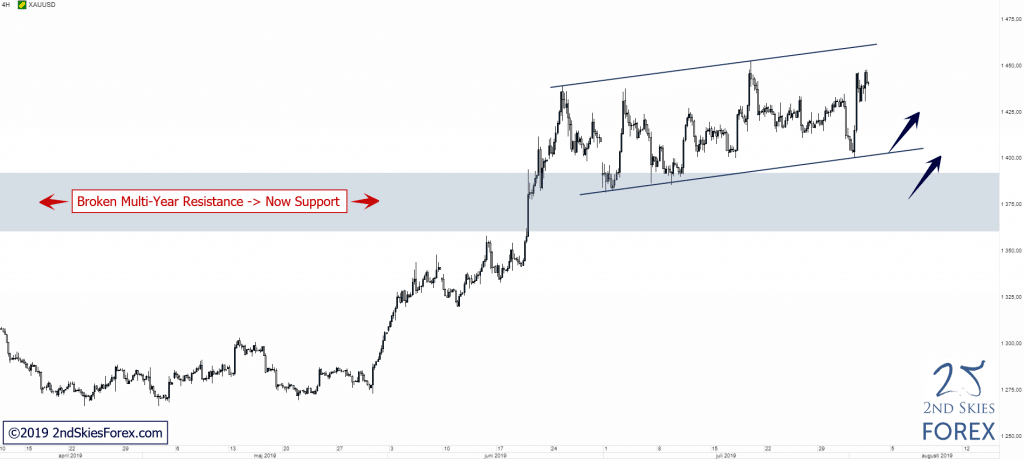
Trending Analysis
LT bias is bullish and bulls can look for potential trading locations on pullbacks towards the CS bottom and LT key support.
Key Support & Resistance Zones
R: 1 437 – 1 453
S: 1 360 – 1 392 (LT Support)
You can trade spot gold via our preferred trading broker here.