Chris Capre’s live open price action and ichimoku trades: EURUSD, GBPUSD, AUDJPY, EU50, SUI 20, INR.FR
New to Forex: Then check out my FREE Learn Forex Trading Course with videos, quizzes and downloadable resources
Looking to learn more about day trading: Read my latest article Forex Day Trading Strategies, Rules & Tactics
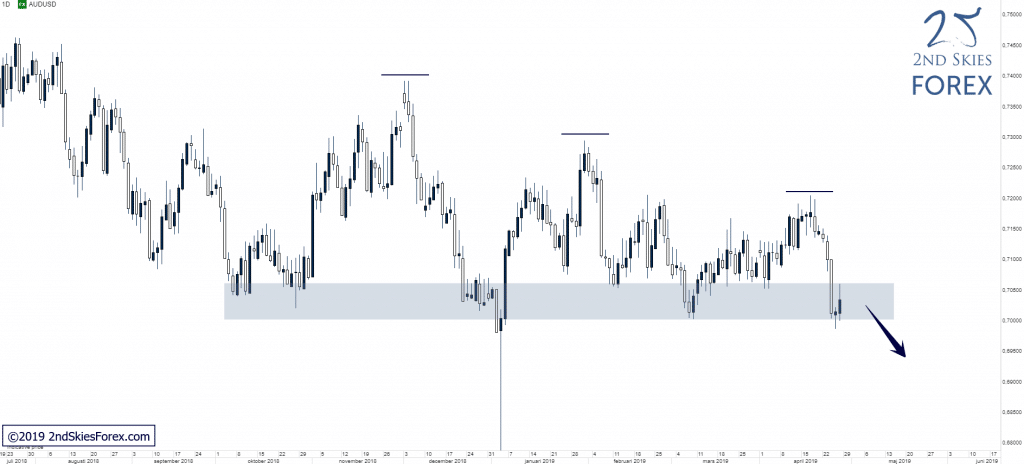
AUDUSD – Bears Trying To Clear Key Support (Daily chart)
Price Action Context
Trading inside of a LT corrective structure preceded by a bear trend that started in January last year @ around 0.81. Since the flash crash and false break in January this year, the pair has been ranging, creating new lower lows, hinting about decreasing bullish order flow.
Trending Analysis
Bearish bias while below 0.7400. A strong break and close below the key support would open up for a likely continuation towards the multi-year support starting to come in at 0.6940, which in turn can offer potential trading opportunities to bears. Should bulls on the other hand be able to defend the support, a move back up towards 0.72 is likely IMO.
Key Support & Resistance Zones
R: 0.7300 – 0.7400
S: 0.7000 – 0.7060
Stay tuned to our members market commentary & trade ideas for updates.
******
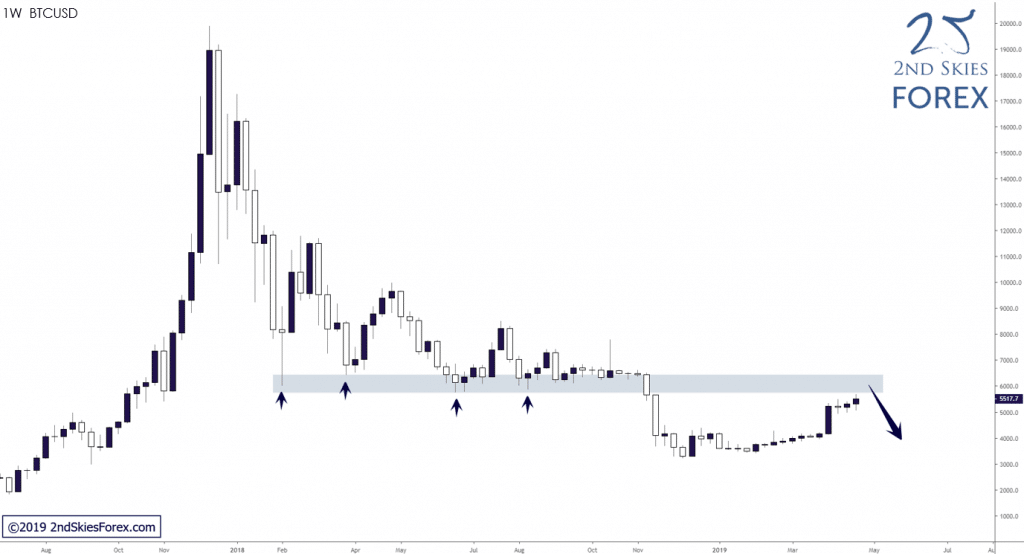
BTCUSD – Closing In On Major Resistance (Weekly chart)
Price Action Context
Bitcoin broke out to the upside of the tight consolidation we mentioned in late March followed by very strong buying and is now approaching a major key resistance zone.
Trending Analysis
LT bias remains unchanged bearish while trading below 6 400 and bears looking for potential shorting opportunities can look for possible locations around the key resistance zone. A break and close above this key resistance would put 7 350 and 8 400 back on the radar.
Key Support & Resistance Zones
R: 5 750 – 6 400
S: 3 000 – 3 500
******
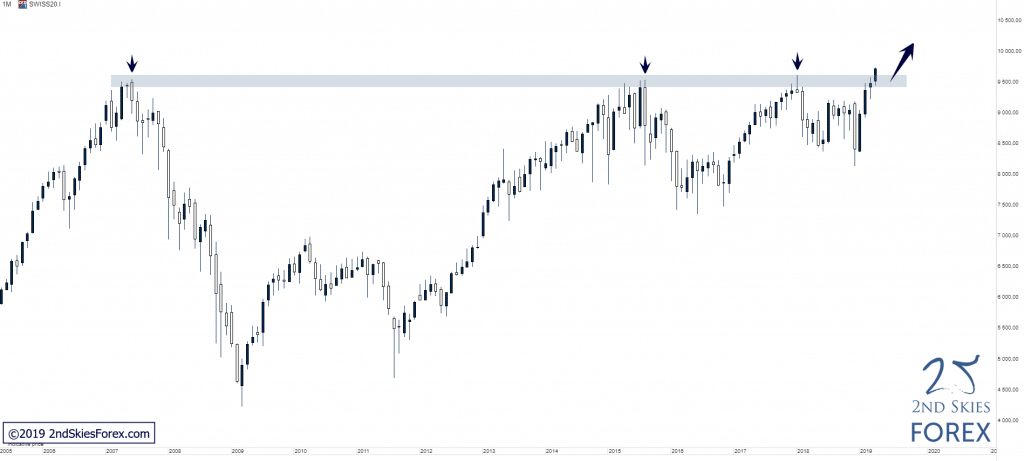
SUI20 – Broken Above Major Multi-Year Resistance, Potential False Break (Monthly chart)
Price Action Context
The bullish order flow was simply too much for bears to counter, and with almost no reaction to the multi-year resistance this time around, bulls have now successfully pushed price above the resistance, creating a new ATH in the process.
Trending Analysis
LT bias is bullish and the index is now in uncharted territory, with 10 000 being the next area of interest to look out for. If bulls are able to hold price above this resistance, weak pullbacks into the broken resistance, which now should act as support, can offer possible buying locations. Should we on the other hand see a quick return back below the resistance, we’d likely be looking at a false break setup which initially would put 8 400 back on the radar.
Key Support & Resistance Zones
R: n/a
S: 9 400 – 9 630

