One of the most challenging aspects for traders is finding and entry point into the market, particularly when looking for reversals or rejections. However this is not as complicated as it seems for there is a tool which is exceptional at helping traders find intraday entries for reversals – Pivot Points.
What are Pivot Points?
Originally created by floor traders, Pivot Points were simply used to mark key support and resistance levels based upon the previous High, Low and Close for the last day of price action. These three metrics were combined, then divided by 3 and this formed the Daily Pivot. The DP (daily pivot) was used to determine if the overall pressure for the day would likely be more down or up. If price opened above the DP, buying was generally preferred and vice versa if it opened below.
From the DP several other pivots were formed which were Resistance or R pivots and Support or S pivots. Finally, after becoming so popular they created Mid-Pivots which were simply the halfway point between any two pivots. Below are the calculations for the pivot point trading technique which we use:
DP = (H + L + C) /3
s1 = DP – (H – DP);//S1
s2 = DP – (H – L); //S2
s3 = L – (H – L); //S3
r1 = DP + (DP – L); //R1
r2 = DP + (H – L); //R2
r3 = H + (H – L); //R3
S1 = Support 1 pivot
S2 = Support 2
S3 = Support 3
R1 = Resistance 1 pivot
R2 = Resistance 2
R3 = Resistance 3
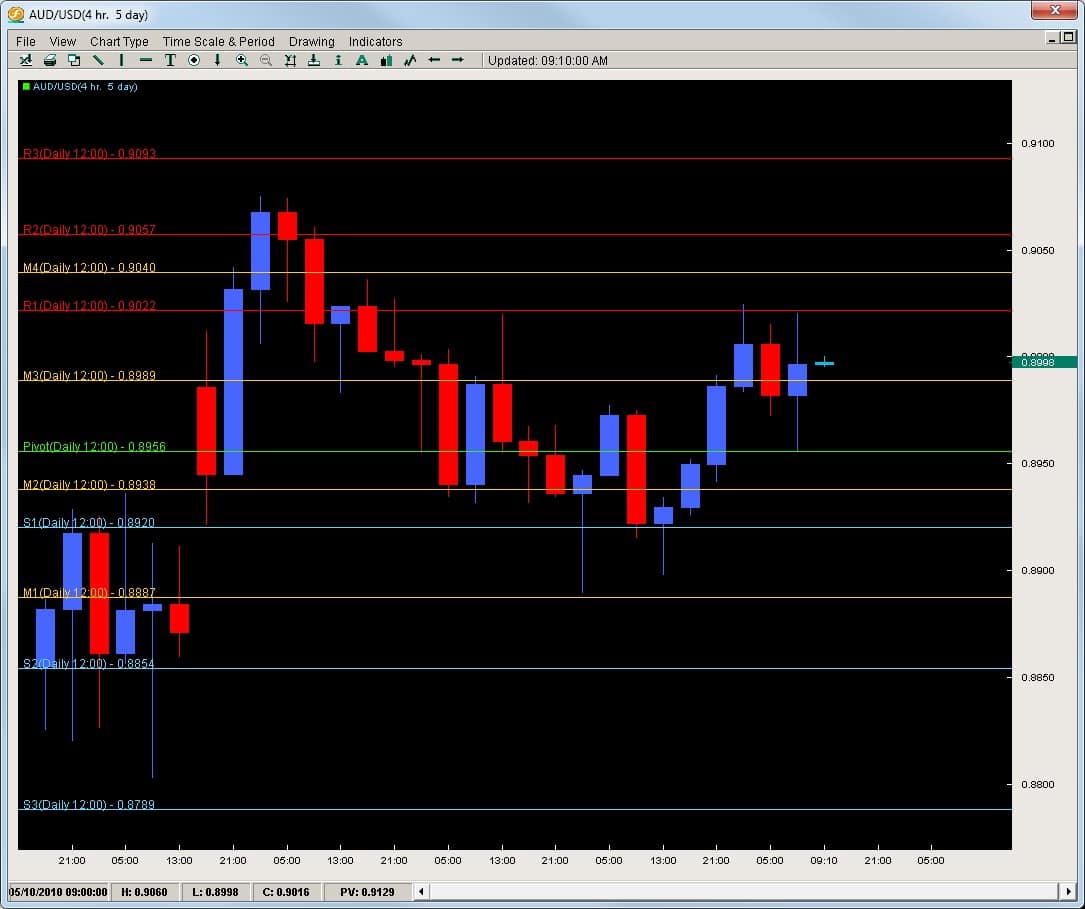
Here is what they look like on a chart below
The blue colored lines are the support pivots and the red colored ones are resistance pivots while the yellow are the mid-pivots. As the name suggests, support pivots are the intraday support levels for that day while the resistance pivots offer key resistance price levels to watch for that day. We set our pivots to the London open since the London traders are basing their charts off their open and with the majority of traders coming out of London, we feel these will be the most effective and consistently watched by the institutional market.
The Statistics
The bottom line is price action has a greater chance to respond to a pivot level for that day than any other indicator out there. Our quantitative research done over the last 10 years suggests every 1hr candle from the London open to NY close has a 70+% chance of touching a pivot. Meaning, if you are going to be in a trade for more than 1hr, chances are the price will touch, react or respond to a pivot.
Since the institutional traders move the market, they are likely placing orders here on an intraday basis more than anything else.
How to use them for Reversals and Rejections?
To use forex pivot points for reversal entry or a rejection/reversal play, the first thing we need to do is find an existing trend or momentum play. If you read our article on Impulsive vs. Corrective moves in reading price action, you will be able to easily spot these.
EURCAD
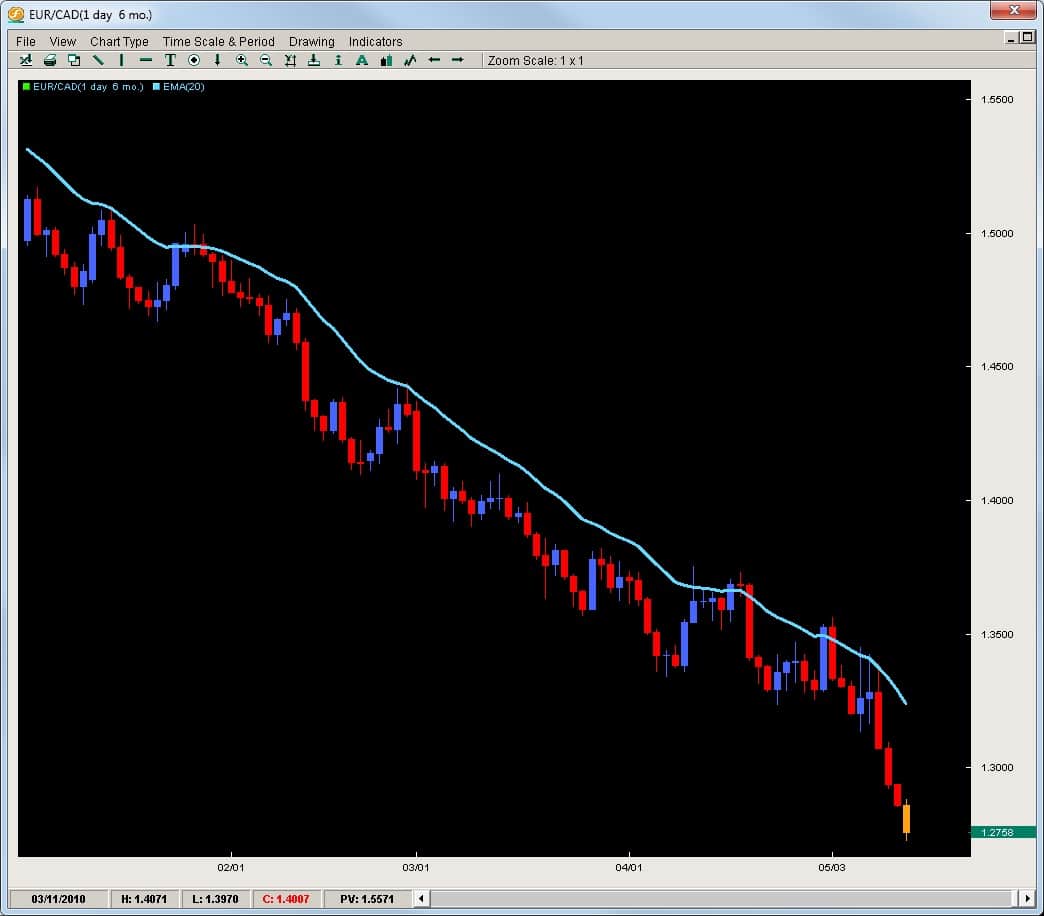
We will start with the EURCAD which on the daily chart below we can see is clearly in a downtrend.
Without needing a heavy IQ to see this is in a downtrend, we will look to take shorts on this pair. As you can see, the pair often pulls back giving us some intraday moves to get back into the trend at a higher price to sell it lower.
The Intraday charts and the Pivot Points
The best way to get into these trends is to find a pullback on an intraday chart, like the 30m, 1hr or 4hr charts. We will use the 30m chart or this example although the pivots should not change as long as you are on any intraday time frame. They should be the same for the entire 24hrs from London open to London open.
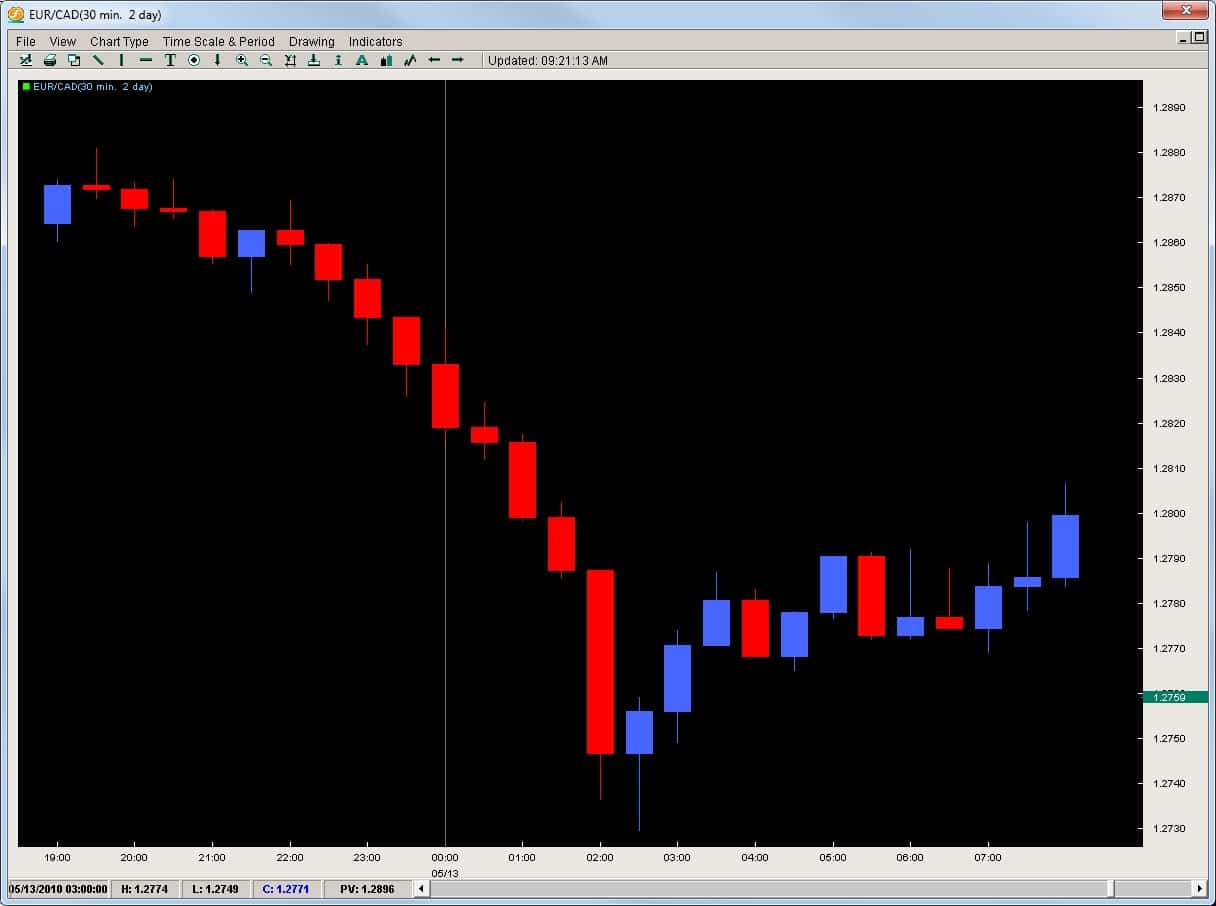
Looking at the EURCAD on the 30m chart below, the pair sold off aggressively and then formed a bounce. It gave a nice pullback which was not impulsive thus signaling the bulls had not come in with a domineering force. See chart below.
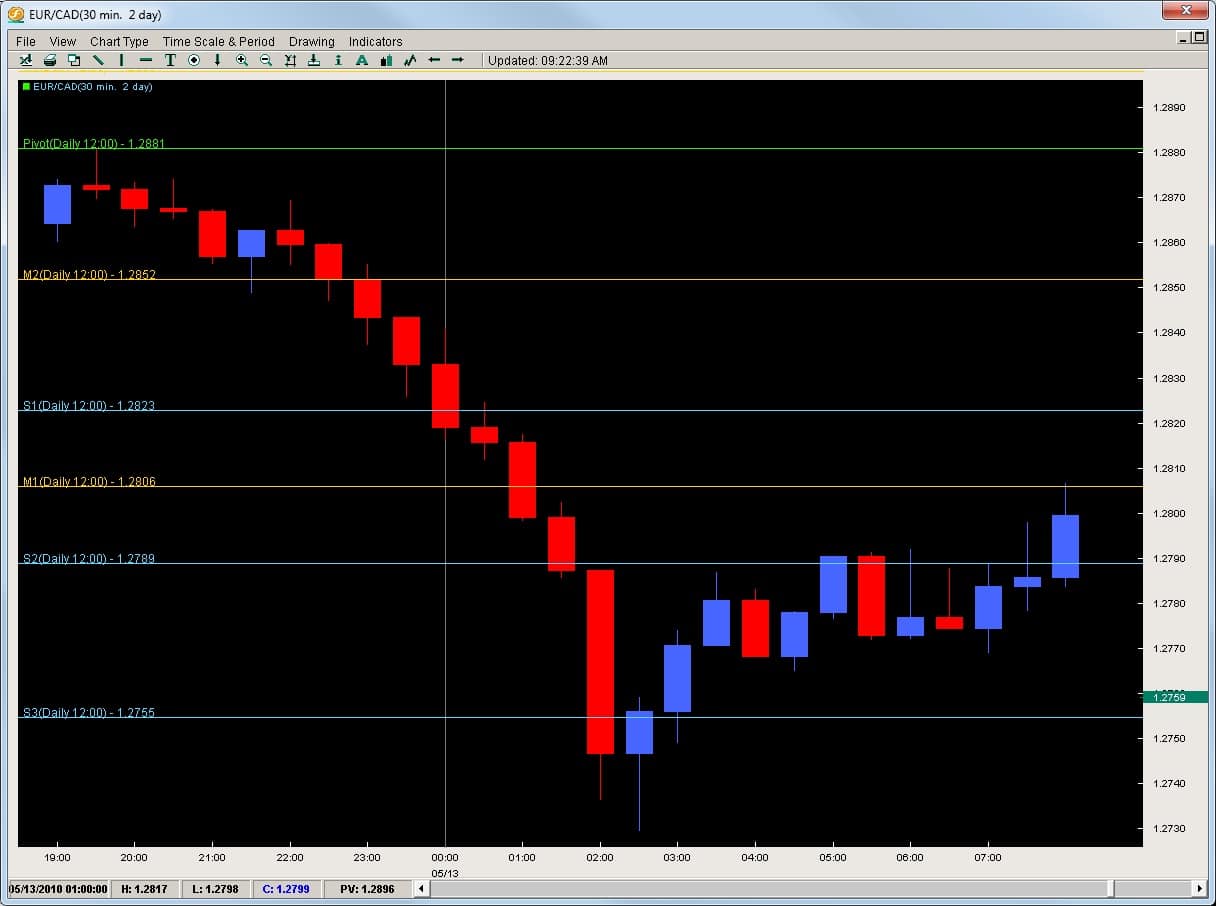
Now, noticing the move back up is not impulsive, we should be looking for a sell entry point to get into the market. The chart above was without pivots, but the chart below has the pivots on giving us a clear price level to get into the market.
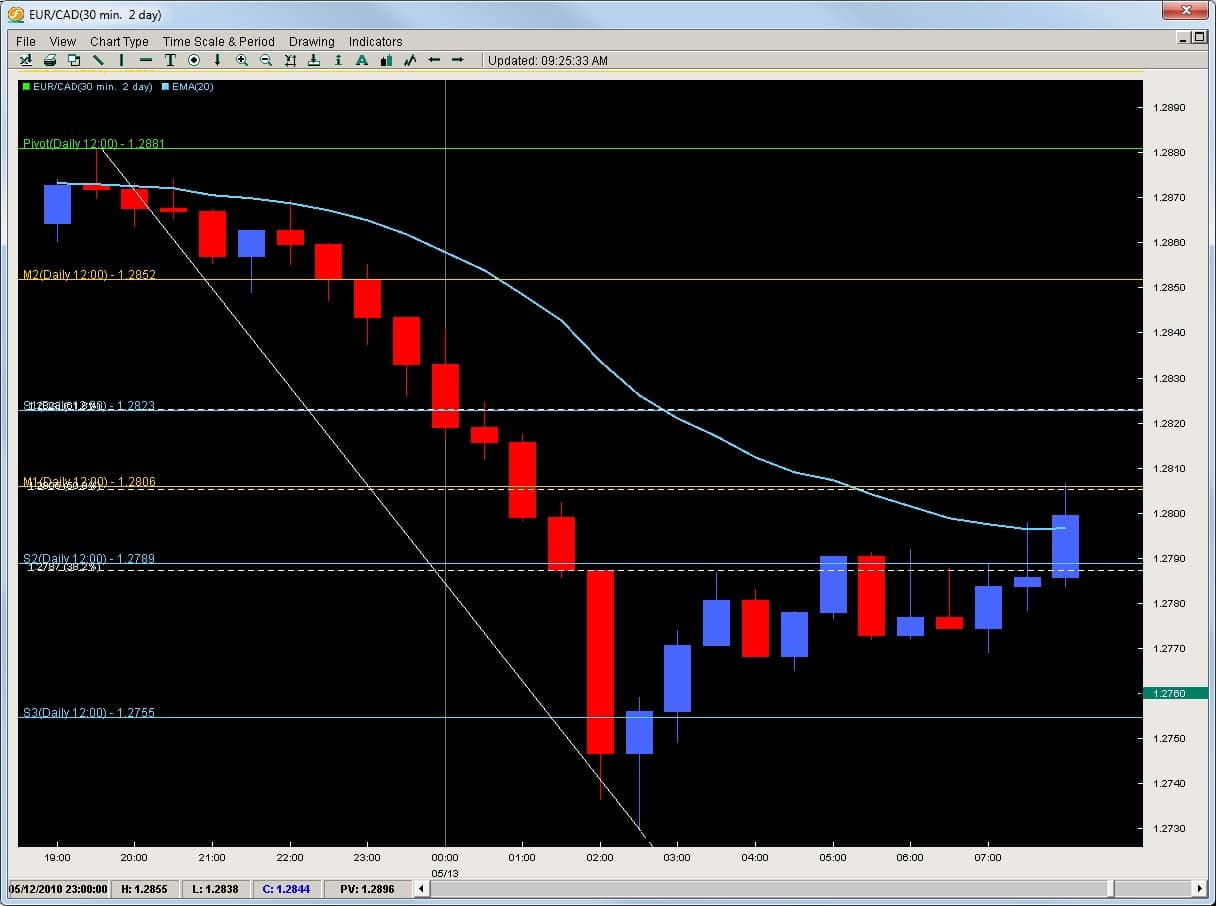
Now we can see how after price reversed a little, it got stuck by the S2 pivot (2nd blue line to the bottom) which rejected price 5x before it broke. Price then advanced to where? The M1 Pivot.
Now pivots by themselves are potent and we can certainly use them for our entries to reject or get into a reversal. However, when we combine them with a 20ema or Fibonacci retracement, they become that much more powerful. Here is the chart below with both of them added onto the chart.
As you can see, they all come together right around the 1.2800 level which gives us a perfect location to get into the market. We could make the argument the Fibonacci levels were more important to the price action on the day, but before the sell-off ended, but until a trend is over, Fibonacci levels cannot be drawn. Hence, we can see how powerful a pivot trading strategy can be and how much price action responds to them since they were affective price before the trend ended and the Fibonacci levels were even drawn.
If you are serious about learning how to trade this market successfully and find simple high-probability trades using pivots and price action, you can check out our Trading Masterclass.

