Earlier this week I had a private skype call with a profitable student of mine (we’ll call him ‘Joe‘ for the purposes of privacy & this article). One of the major benefits of becoming a member of our price action course is you get a free skype call with me whereby I analyze your trading performance across a baseline of trades, and give you direct feedback across 20+ metrics to find leaks, patterns of your behavior that are hurting/helping your performance, and how we can refine your trading plan to make more money.
I recently highlighted one profitable student (Sam) who made +11% profit over 2 months using exceptional risk management (see image below):
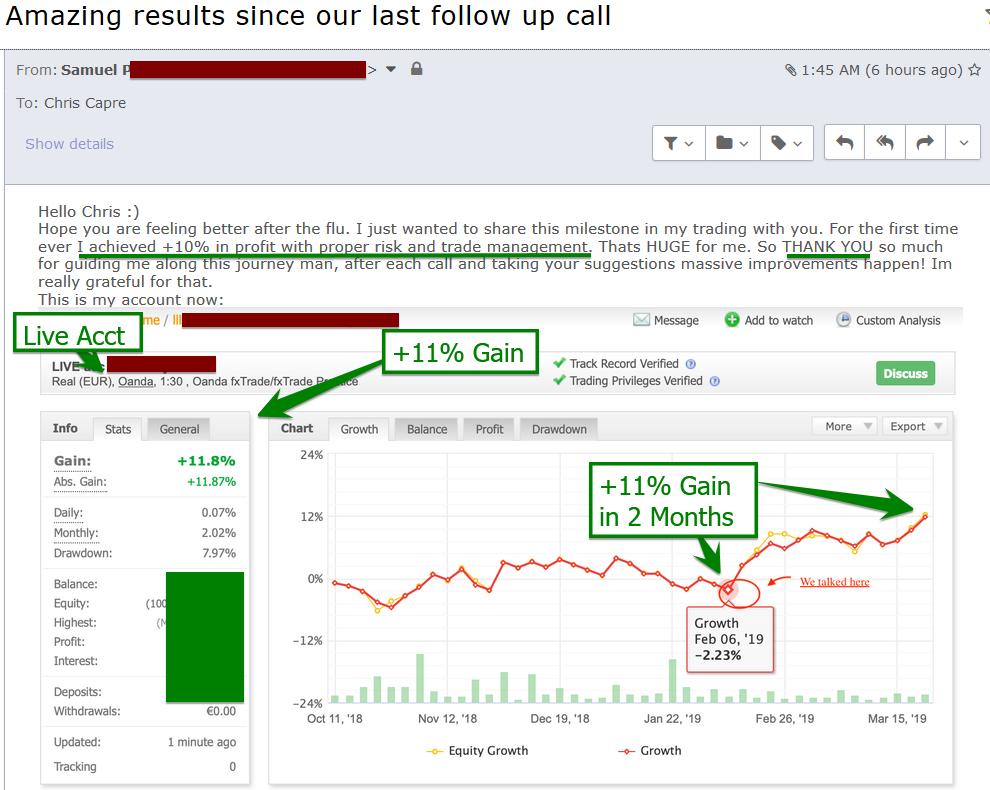
Now if you look at the performance and equity graph above, Sam was a consistently break even trader until we did our skype call analyzing his performance and giving concrete recommendations for how to improve his trading. Two months later, he had a breakout performance with his most profitable months of trading to date.
Meet Joe Black – The Profitable Trader
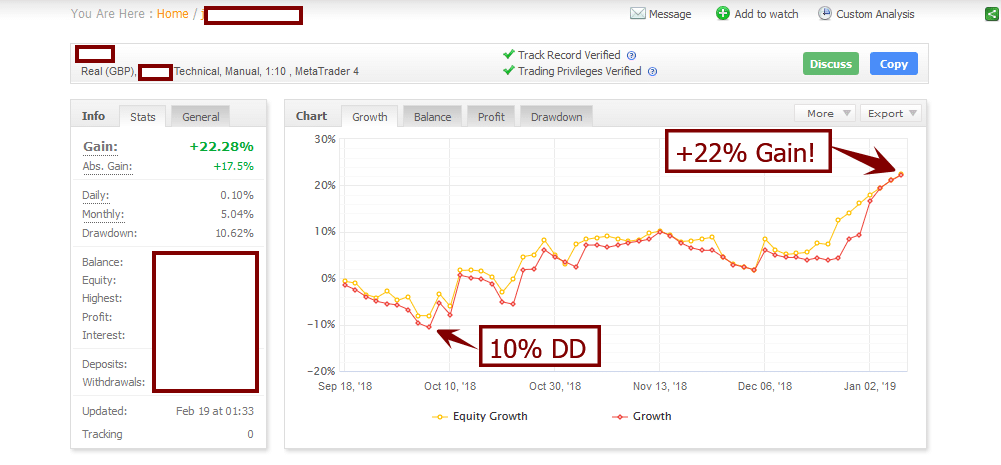
Joe, whom we talked about earlier, is also a profitable student of mine who had performed exceptionally well from mid-September till the end of the year, making +22% profit over 4 months, even while having a 10% draw-down!
Here is a snapshot of his equity graph during that time period.
Now before we analyze his performance since then, I’d like to point out the stats and highlights:
Total Profit/Loss: +22.25% (shown above in equity graph)
Avg. +R Per Trade: +3.23 (image below)
Total # of Trades: 149 trades (image below)
NOTE: 149 trades over 4 mos = 37 trades per month – try getting that many trades and feedback trading pin bars and confirmation price action signals)
% Accuracy: 33.6% (image below)
Profit Factor: 1.63 (image below)
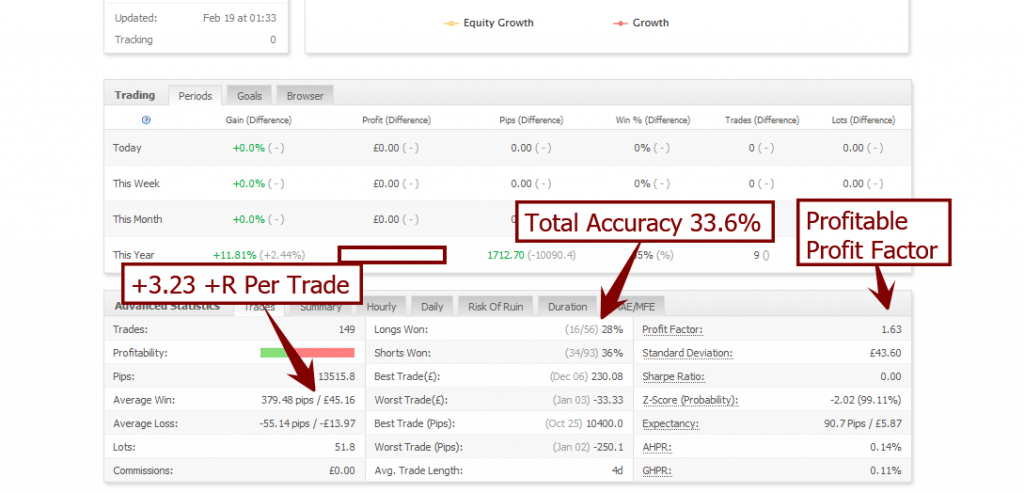
Risk of Ruin: ZERO (image below) NOTE: If you do not understand what the risk of ruin statistic means, click here.
Instrument Performance: Total of 5 instruments that gained +2-5% profit, while only 1 instrument with a 2% dd (image below)
Risk Management: .5% risk per trade (which showed excellent discipline here)
Total Return: +44R!
Summarizing Joe’s Trading Performance
When you examine the above statistics, Joe performed exceptionally well and had a fantastic quarter to end the year. In fact, his +22% gain over this time period would have beaten out most hedge funds yearly performance, so kudos to Joe.
And Then…The Drawdown
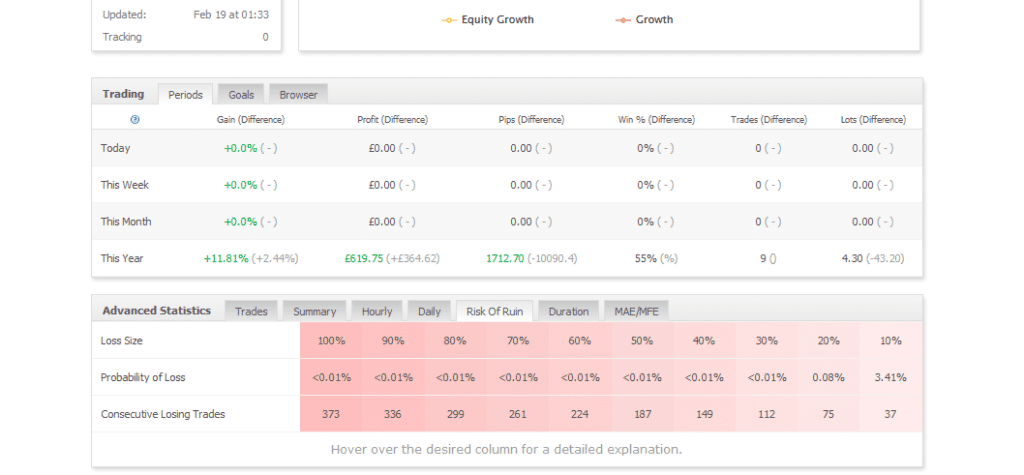
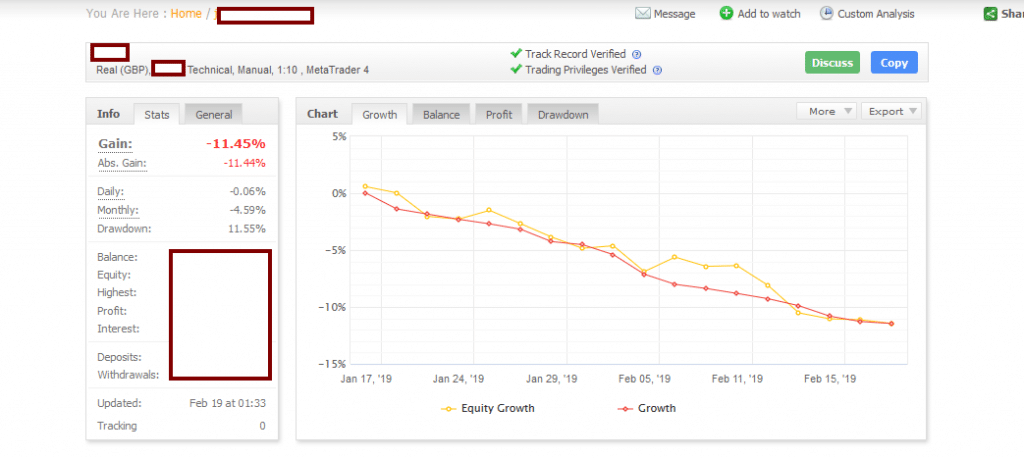
While Joe beat out most hedge funds last year, this year has started on a different note. Since Jan. 17th, he’s down about 11% (see below).
While some things in Joe’s life has changed, and had some negative effects upon his trading mindset and performance, something else seemed amiss behind the night and day change. Joe reached out to me to see if we could do another Skype session and analyze his performance, so we dug into the numbers.
Now tell me what seems out of whack below with the stats:
Total Profit/Loss: -11.45%
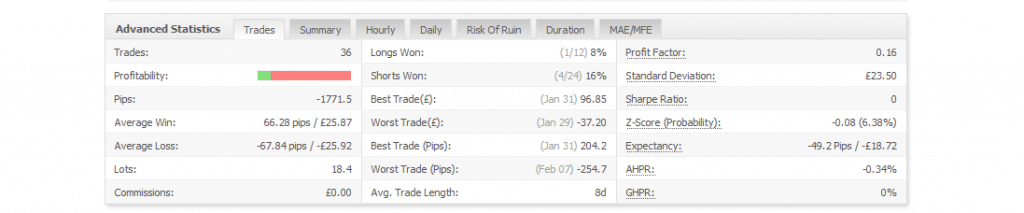
Accuracy: 13.9% (image below)
Avg. +R Per Trade: .99R (image below)
Profit Factor: .16
As you can see, all the stats are down, but which ones stand out the most? The accuracy being down isn’t helpful, but what is more damaging is his Avg. +R per trade went from +3.23 to .99! That is a drastic difference.
Regardless, accuracy is always in flux when it comes to performance. % accuracy usually operates within a range for traders. It never stays fixed from year to year. So if you’re 54% accurate in one year, the chances of you ending up 54% accurate in the next year is slim to none – don’t bet on it happening!
When I saw Joe’s Avg.+R per trade was down, I immediately started to wonder ‘why‘? If accuracy goes down (it happens) it will obviously affect your overall performance. But why would Joe’s Avg. +R per trade go down? Why would a trader be getting less per trade then their past 149 trades?
There could be many reasons ‘why‘, but to name a few:
1) you’re taking profit too early/earlier than you were before
2) you’re not feeling confident, and thus trying to close any trade for profit instead of letting it run
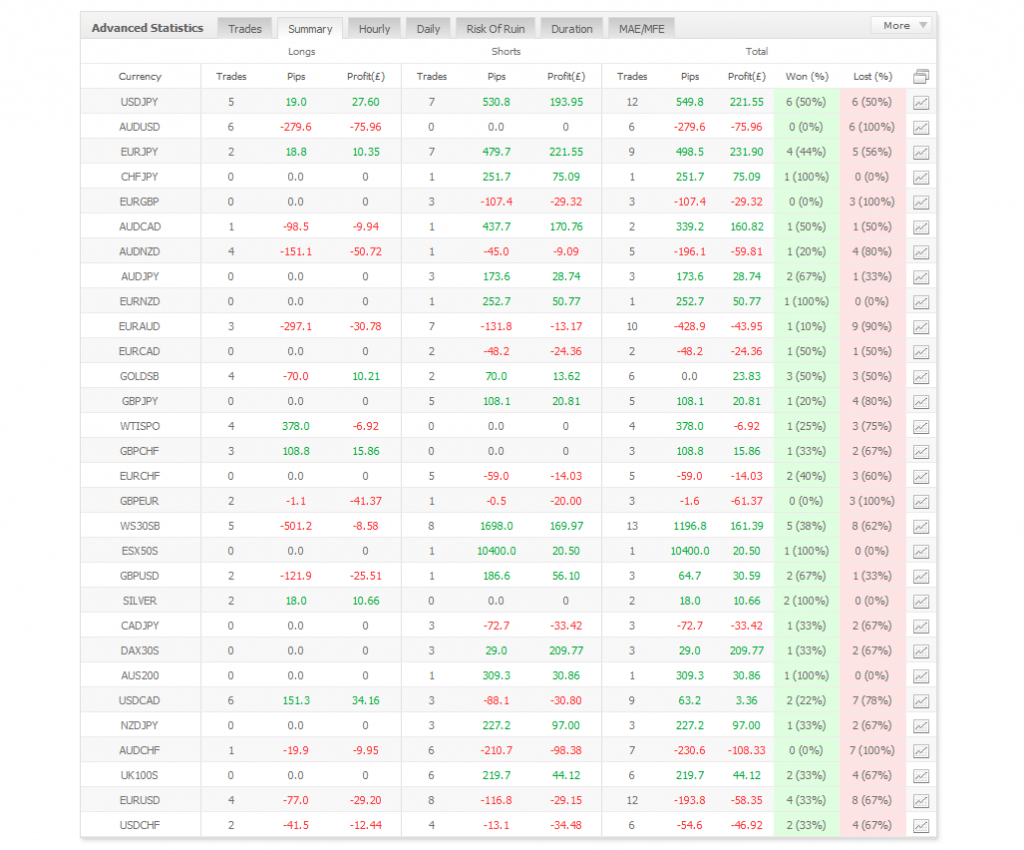
I could honestly list a litany of reasons, but the summary tab (which analyzes performance per instrument) was the most revealing (see below):
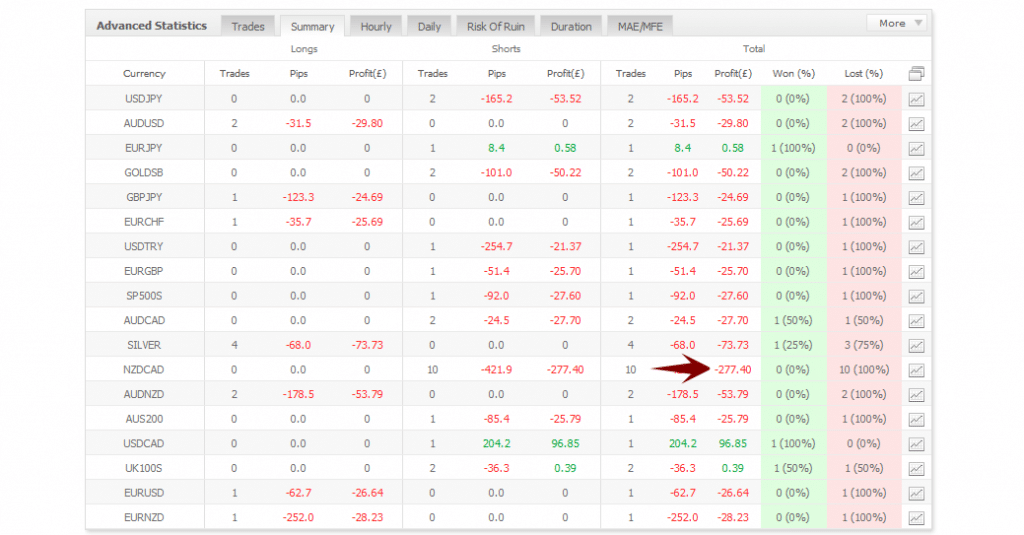
First off, his biggest losing instrument was the NZDCAD which accounted for 40% of his total losses! It’s important to note Joe wasn’t even trading the NZDCAD in the prior 4 months. So he was including a new trading instrument into his trading plan.
Upon further questioning, I uncovered another ‘reason‘ why his performance had slipped so much. Joe had developed a bias on the CAD as a whole. He felt the CAD was about to move into a place of strength, so was bearish on any XXX/CAD pair across the board, including the NZDCAD.
Despite losing every trade on the NZDCAD (10 total), and the price action charts continually ranging or climbing, he held onto his bias and was continually shorting. This obviously had a negative affect upon his performance (holding onto a bias, regardless of what the charts are communicating rarely ever works).

Accuracy Gaining/Declining Shouldn’t Affect +R
Accuracy going down shouldn’t translate into you to going for much smaller targets. Your overall +R per trades should remain stable regardless of you performing well or not. If you consistently go for +2R, winning and losing shouldn’t change this.
Now there were a lot of other metrics Joe and I went through on our private skype call, but two things that became evidently clear were:
1) Joe had made some major changes to how he traded, and
2) Joe needed to have that skype call with me.
This is why I cannot over-state the importance of having a trading mentor. And it’s not just about having a trading mentor, but about having one who can look at your individual performance, and help you see what you’re missing that’s causing you to not get the maximum profit out of your skills and price action trading.
This feedback model I have with my students has been a game changer. I’ve turned break even traders to become profitable traders. I’ve turned losing traders into winning traders. I’ve helped students like Joe spot major issues during a draw-down, and help them correct course. If Joe hadn’t reached out to me, he could have easily kept trading and losing more money.

Hence you have to look at what is the feedback model you’re getting from your trading mentor, and how much can that change your performance. If you’re not getting any analysis and feedback from them, then your trading mentor is just an information dispenser. And without analytical feedback, how would you ever know what mistakes you’re making, and how to correct them?
Thus ask yourself – how valuable would such feedback be for your trading to have an analytical session with your trading mentor digging into your performance, and finding patterns in your trading and numbers you didn’t even know existed?
Is that worth a few hundred dollars, let alone being taught the skills and trading strategies to make money?
In Closing
With that being said, if you’d like to learn how to become a member of our price action course, where you’ll get this type of feedback, along with access to our members market commentary & trade ideas, members trade setups forum, and over 60 hours of trading videos and lessons, click here.
Please make sure to leave a comment and share this with anyone you think will benefit from this.
Until then, I hope you’re seeing real change in your trading performance and mindset.