Reversals are one of the most common elements in markets traders are wanting to either know of to avoid or confirm their trade. The clues to whether a reversal is in play are hidden in the price action and easily found. These key elements are found in rejections which show up in the price action formation of long wicks occurring at key price levels.
Starting with the Rejection Wicks
The key point in a candle which confirms a rejection at a key price level is a wick and the larger the wick, the better. With that statement comes the question of ‘how much or how large the wick should be to be considered a strong wick.’
The answer to this question would be a minimum of 50%.
Why?
Because this is the minimum amount to satisfy the condition that one side of the market does not have more control than the other. Think about it like this. If price is in an uptrend and starts to approach a key price level, once it touches this key price level now creates a wick which reverses 50% of the price advance of say a 4hr or daily candle, this 50% rejection means the bears were able to stop the upward force/momentum of the current uptrend and 4hr/daily candle, but were able to push prices back 50% of that candle and move. This would translate into the bears having at least as much strength on the board in terms of order flow than the bulls because they were able to take half of the gains and eliminate them.
In some sense, it would actually translate into more strength because they also had to stop the momentum which was already upward. Thus, to stop momentum on any moving object takes energy and force. This then translates into there being the minimum requirements for a reversal for it demonstrates the bears have the minimum energy and force to reverse the trend.
Obviously the larger the wick the better because if the bulls who have the current handle on the market run into some sell orders and are not only unable to keep advancing price, but get pushed back quite a strong amount, this means the bears have taken short term control of the market and this can be seen in the price action.
Remember, a wick is a rejection of price. If price was accepted at a certain level, it would stay there or advance past it. However, if the order flow in the market does not support price being at that level, it will reject it and send it back because the institutions would be finding that price over-valued and time to sell. This is what it means when we say a wick is a rejection of price action.
Using them at Key Price Levels
This is the trickier part of your assignment – finding the key price levels. However with a few simple tools, its not that hard to confirm. We will suggest three tools to help you confirm the reversal is happening at a key price level.
Before we do, its important to note this works better on time frames such as the 4hr and daily charts. Anything below this does not contain enough time to signify an important impact on the market. Thus, when we are talking about these, we are referring to the 4hr or daily charts.
1) Pivot Points – key price levels that are respected and watched by all institutional traders, when strong price rejections occur at key pivot levels, they often have more impact. Why? Because institutions place intraday orders around pivots more than anything else. They enter the market at these locations more than they do any other price levels so when we see price reject strongly off a pivot point – it usually has more impact.
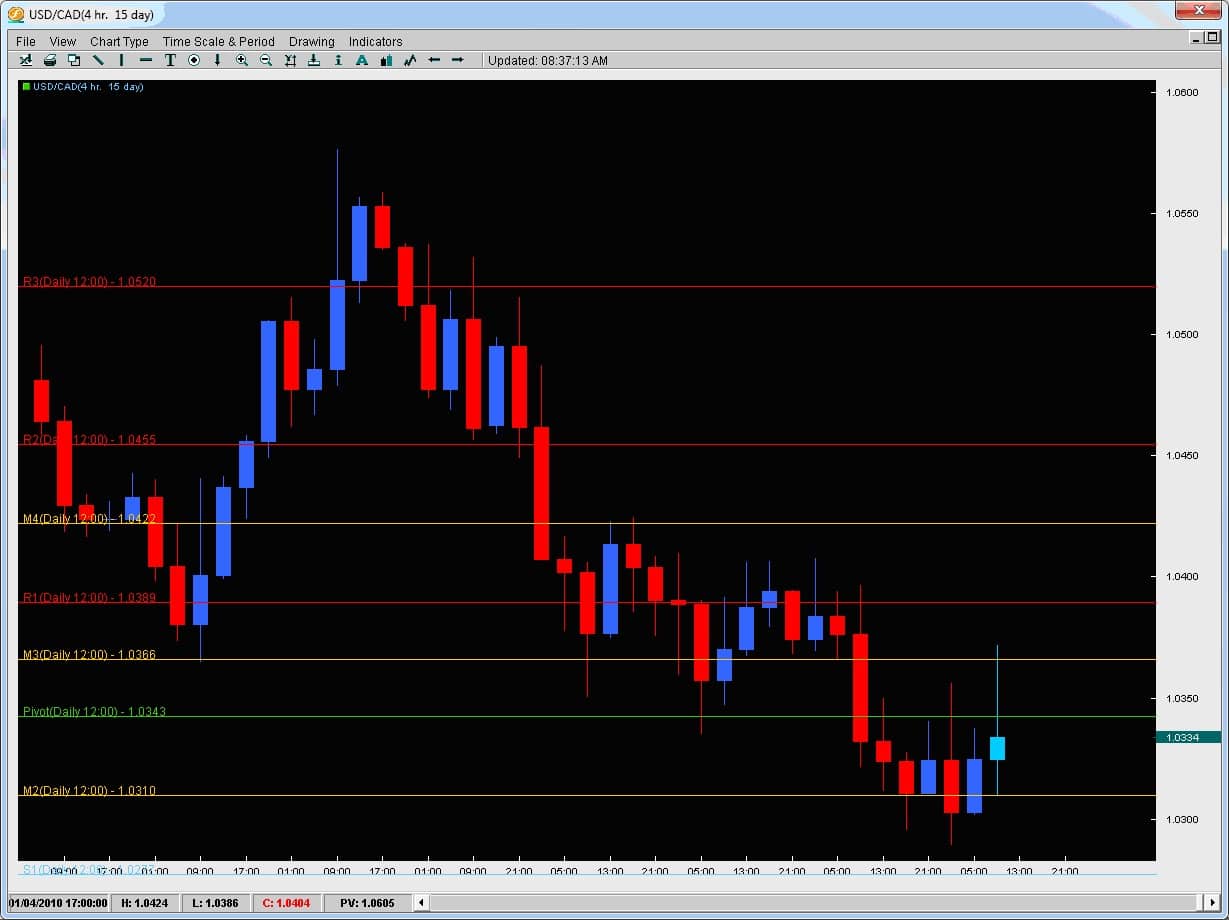
Taking a look at Exhibit A below, we can see how the price action had a pretty strong intraday rejection off of the M3 pivot level at 1.0366. This was the highest price surge for any candle on this trading day and it rejected back down below the daily pivot to stop where? At the M2 Pivot showing you the market is respecting these two pivot levels.
The fact that this pivot also happened to line up with a lot of the support for the candles to the left along with the swing low all the way to the left of the chart at the same price level shows this to be a strong intraday price rejection point. One can also notice the candle is over 50% of the entire candle’s size suggesting its strength. One other key point in the price action is that there is two way interest here as the support of this candle lies with a decent rejection to the downside which is also at a pivot.
Thus, when rejections occur at intraday pivot levels, they have more potency so look for them to line up at a pivot whenever possible.
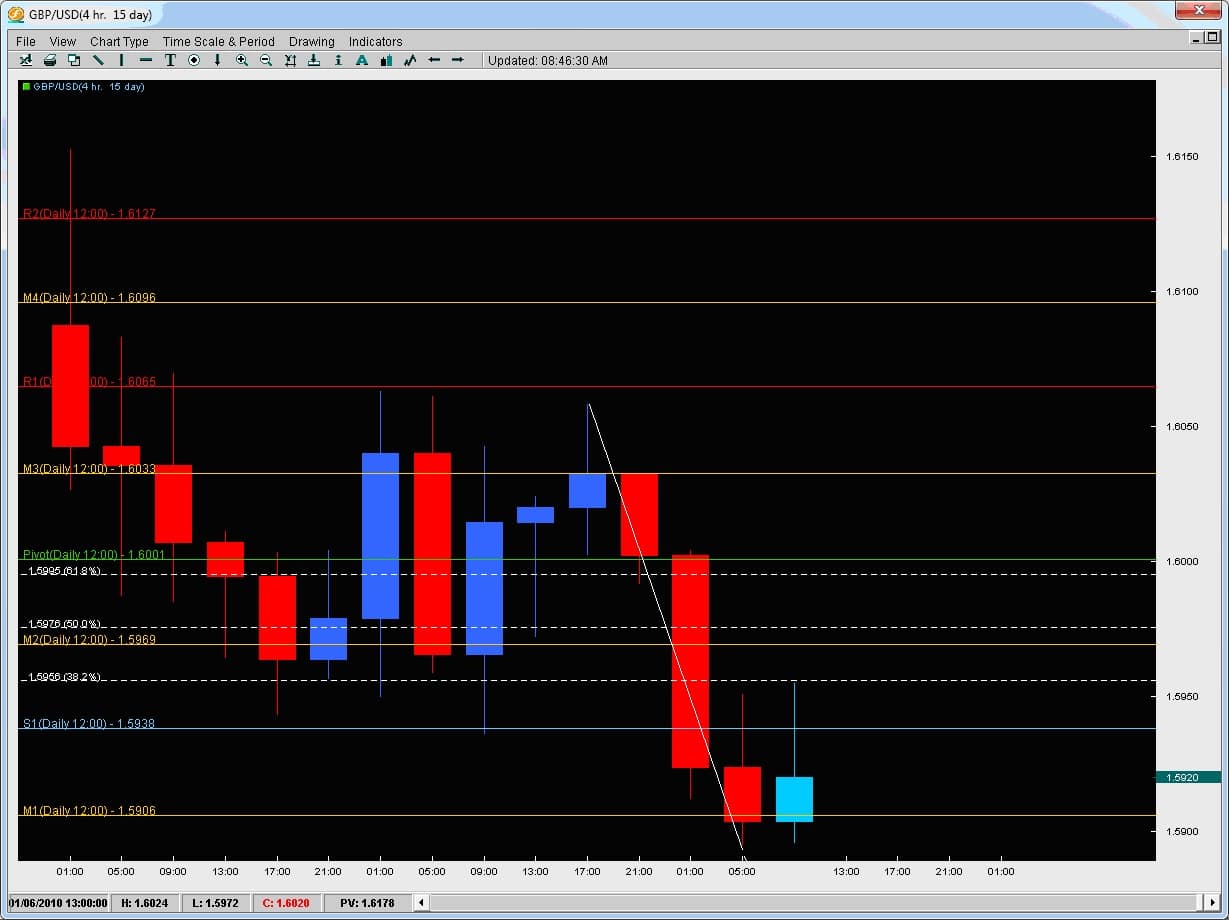
2) Fibonacci Levels – another tool to look for and help confirm the rejection is for them to occur at key Fibonacci levels. Which ones would we consider key? The 38.2 / 50 / 61.8% fib levels. Now which fib levels are the next question because they can be drawn from anywhere. Anytime you have a strong trend in place, there will be market swings and corrections. Fibs were meant to be used during trends to find retracement levels where pairs would find support/resistance in their current trend to continue the trend. Thus, when we pull fibs, we always pull them in the direction of the trend looking at the major swings. Below is an example.
In this chart above we have the GBPUSD 4hr chart where price was consolidating after a downmove and then started another leg down. Price hit a floor around 1.5900 and then started to attempt a reversal. However it created two rejection wicks right at the same level which was not only support for the previous consolidation move but also a 38.2% fib level thus making it a good rejection area according to Fibonacci price levels.
By combing previous support/resistance levels along with a key Fibonacci level, when a rejection wick occurs at these levels, it gives it further confirmation of it being a legitimate rejection.
3) Key Support/Resistance Levels – previous swing highs and lows are great places to look for rejections to take place because the market had already rejected price there once before. If the market rejected price at a key level once before, it certainly should be considered it could happen again.
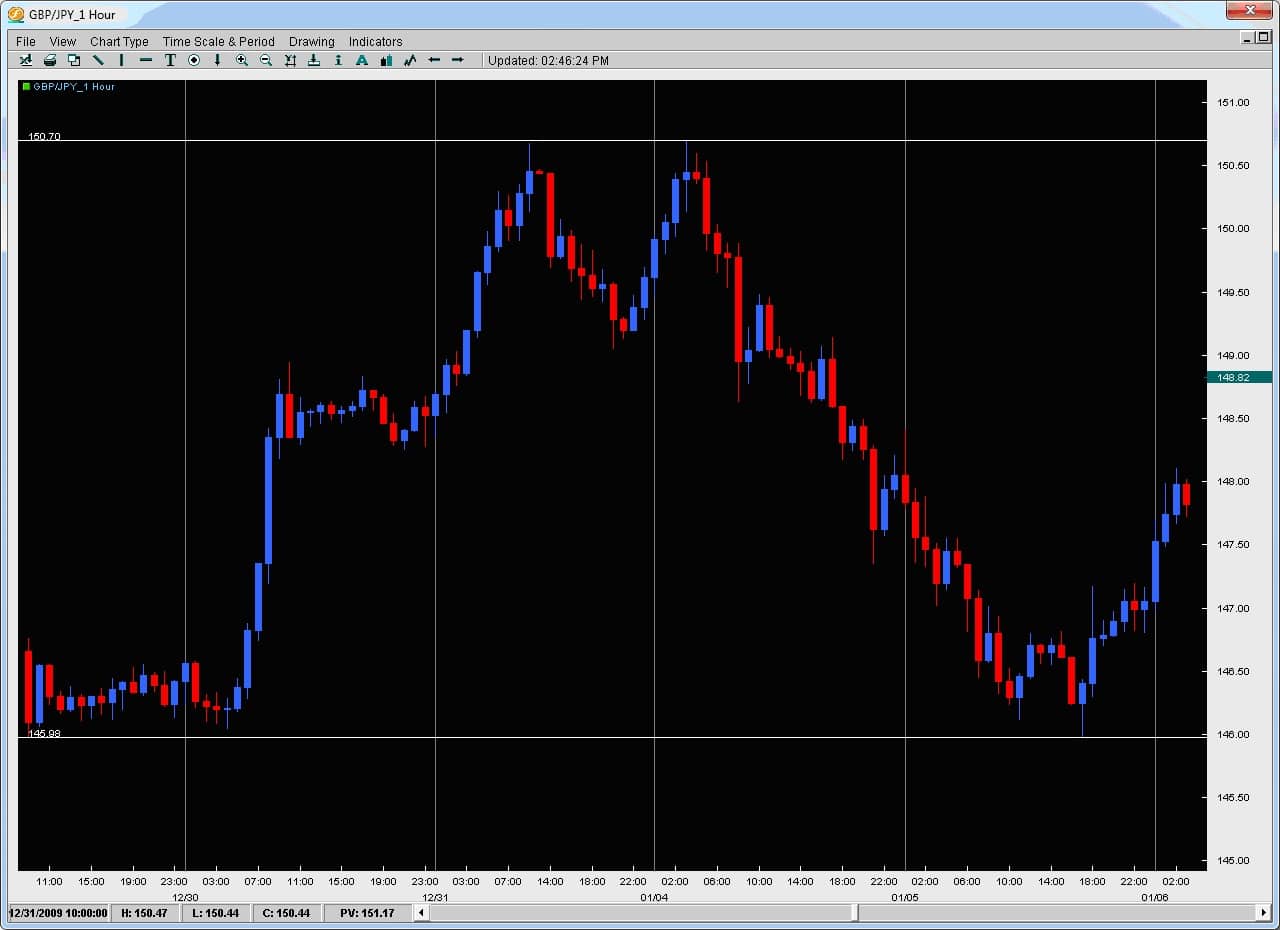
Looking at the chart below, we actually have two examples in the same chart. Starting at the bottom the price action was stable and holding at a particular level building a base around the 146.00 handle. After several touches on this price level, it launched up towards 150.68 where it rejected back down to 149.00 or 268 pips. It then very quickly re-advanced on this same price and swing high only to create a very strong rejection at this level by producing a very large wick. The price action from here then went all the way down to where? The last major base of support down at 146.00. Thus, by spotting these previous key swing highs and lows, and looking for larger rejections off of them, we can find great trading opportunities or examine the price action to confirm our reversal trade.
To learn more about how to spot these simple high-probability setups and how to trade reversals with rejections, you can check out the Trading Masterclass or the Advanced Ichimoku course which will teach you rule-based proprietary systems to trade these profitable setups.

