If I had to follow only one simple rule of price action, it would be to understand impulsive and corrective price action, and if I could only trade one type of move, it would be impulsive moves hands down. They offer the most profit potential, communicate where the institutional players are buying and selling, whether they are buying or selling, and what the dominant trend is.
This is not to say one cannot make money trading counter-trend, but that far more money and profit will be had trading with the trend, but to be more specific – trading impulsive moves.
The Base of the Pyramid
If I had to look at price action as a structure, it would be a pyramid, with the base being how price action is a reflection of order flow (particularly executed transactions). The next part (or level above) from that base would be understanding price action through the lens of impulsive vs. corrective moves.
I will briefly describe what impulsive and corrective moves are, giving the key characteristics of each type of move. Then I will discuss what they generally communicate from an order flow perspective. After this I will talk about what is the general pattern they will form, and how you can use this for trading impulsive moves.
What Is An Impulsive Move?
An impulsive move is one whereby the market moves quite strongly or heavily in on direction, covering a great distance in a short period of time. These moves tell you when the imbalance between the buyers and sellers is really strong and there is heavy participation from the institutional side.
Logically, more money can be made during these impulsive moves, as they cover more points or pips in less time. They are generally more volatile, and thus provide us with great opportunities to get more R (reward) with less risk since the market will stretch more easily in one direction. But no matter what, we want to be trading with these moves as much as possible, not against them.
Three Characteristics
Impulsive moves tend to have three characteristics common among all of them. These three can help clue you in to when an impulsive move is starting, or in play. They are;
- Large Candles (bodies)
- Mostly of one color (blue/bullish, or red/bearish)
- Closes towards highs/lows of the move
Let’s examine all three points.
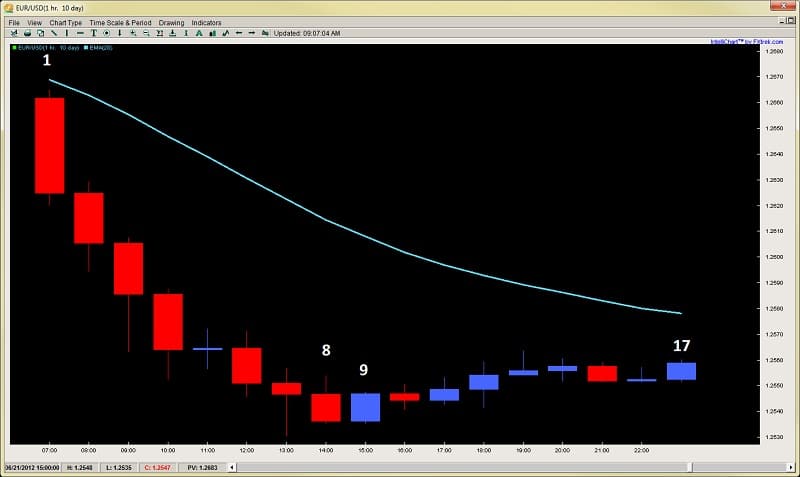
1) Large Candles communicate to us there is strong participation and order flow behind this particular candle. Strong imbalances during a candle will translate into larger candles than the norm. When you see large candles forming consistently in one direction, they indicate strong order flow behind them from the institutional side. Since the larger players are behind them, they give us a clue of the direction we want to take, essentially surfing the waves they (institutional) are creating. Take a look at an example below.
Notice how in this chart, the candles that stand out the most are the red ones, particularly the ones towards the top left? They are the largest in this entire series, communicating strong order flow behind them.
In fact, if you look at candles 1-8, all but the blue doji in the middle are solid in size. Yet candles 9-17 are all contained within the highs and the lows of last 2-3 candles in this down leg, communicating weak order flow and participation behind them.
As a whole, impulsive moves tend to have large candles (bodies and wicks) behind them.
2) Mostly of One Color – this ingredient is also common among impulsive moves as it communicates something critical to us – time. More specifically, how the bulls or bears were able to maintain control of the price action over time.
In the chart above from image 1.1, you will notice in the down leg, there is only 1 blue candle, meaning for 8 out of 9hrs, the bears had complete control of the market (almost one full trading session).
By maintaining control over time, the market is communicating who is the more dominant side because they are not allowing the other to take control of a candle for that time period. The greater the imbalance is between the bulls and bears over time, the greater the dominance is from either the bull or bear side of the market.
It is important to look at price action not just based on structure of the candles, which is one dimensional. Price doesn’t just move in a vacuum, it moves in time, and HOW price moves over time can communicate a lot of information to us as traders.
3) Closes Towards the Highs/Lows of the Move – If you think about it, when the market is in a strong trending move, let’s say using a 4hr chart, and the candle that closed in the direction of the trend (in this case uptrend) has a very small wick, thus a strong close towards the highs, what does that communicate?
It should communicate that there is very little profit taking from the players behind that candle. If they were worried going into the close of that candle about an upcoming resistance level holding, or perhaps the bears may take control of the market, they would likely close their position, or take profits right before the candle closed.
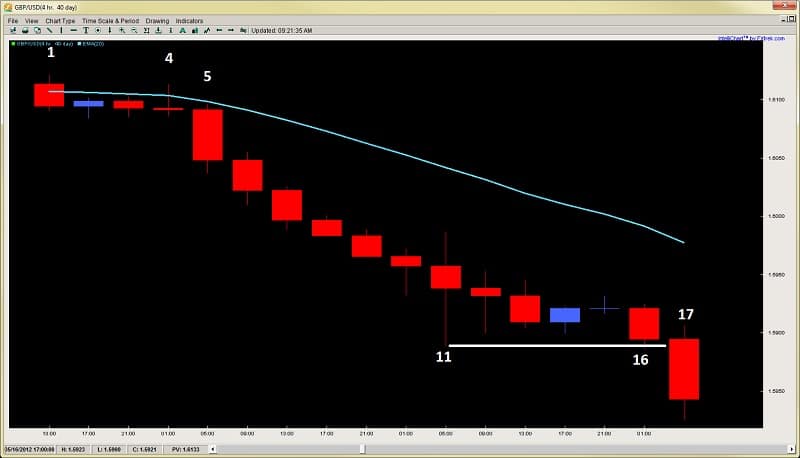
But when you have a strong close with a very small wick, this usually indicates very little profit taking, thus a confidence the move will likely continue. This is highly useful to us as traders, and will be common among impulsive moves like in the chart below.
Image 1.2 GBPUSD 4hr Chart
Starting with the top left of the chart using candles 1-4, the price action moves in a sideways corrective fashion until candle 5, which if you notice, increases in size tremendously (rule #1 of impulsive moves). From here, price continues on selling for the next 9 candles, 10 total in a row, or 40hrs of selling (rule #2 of impulsive moves).
But looking at the candle closes, you can see most of them are towards the lows, showing very little profit taking along the way, thus suggesting likely continuation.
Only until candle 11 do we get a strong rejection, and from here price then moves sideways in a corrective fashion until candle 16. But what happens at candle 17? The candle expands (rule #1) telling us the trend will likely continue.
So these are three examples of the common characteristics of impulsive price action moves.
What About Corrective Moves?
The good thing about corrective moves is they are easy to spot, since they have the inverse characteristics of impulsive moves. Meaning, they tend to have;
- Smaller Candles
- Greater mix between red/blue or bull/bear candles
- Closes more towards the middle with larger wicks
Thus, if you apply the logic of impulsive moves, you can easily understand and identify corrective moves.
How Do They Relate to Each Other?
Generally, impulsive and corrective moves tend to have a common pattern or dance with each other. The general pattern that tends to play out between them is the following;
1) Impulsive moves about 75% of the time are followed by corrective moves. These corrective moves can either be horizontal, slightly against the impulsive move, or even slightly in the same direction, but they denote a change in the order flow and participation.
2) 75% of the time, these corrective moves are followed by impulsive moves in the same direction as the original impulsive move. Why?
Because those who are in control, rarely give up control unless encountering a strong counter-trend force. Even then, they usually make a second attempt to take out a recent swing high or low before giving up.
Only when they fail a second time will they usually exit the market, either waiting for a new chance to get in on a pullback, or reset completely. This is why V-Bottoms are quite rare and only form about 10% of the time. Usually there is a 2nd bottom, which is could be a LL (lower low), HL (higher low) or a similar low.
3) This series between the impulsive vs. corrective moves will generally continue until the market encounters a counter-trend impulsive move, which usually translates to an equal or greater force on the opposing side of the market. Very similar to Newton’s Laws of Motion about an object in motion will stay in motion until acted upon another object with equal or greater force.
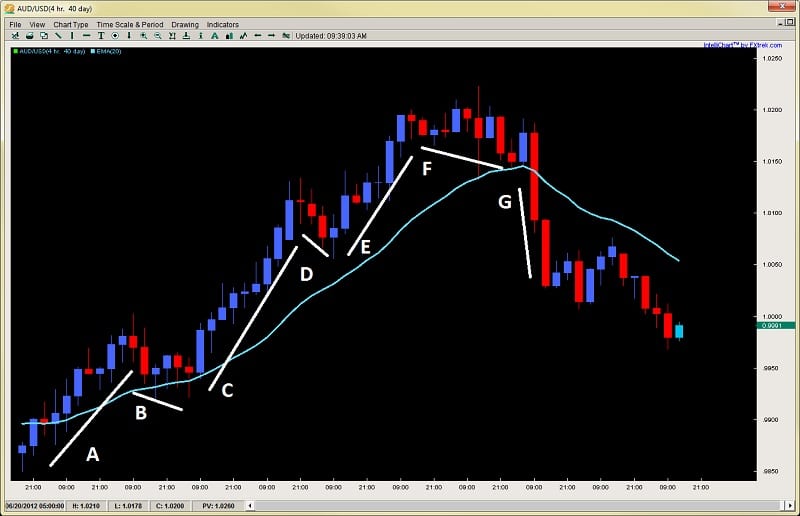
Let’s look at an example below.
Glancing at the chart above starting with the bottom left at move A, you can see how it was an impulsive move, followed by a corrective move (B). This series continued until…it hit a counter-trend impulsive move in G. It was only until here did the bulls finally relent control as the opposing bears took control of the price action with the bulls likely taking profit or exiting all together, especially after the low point from move D was taken out. Ironically, what followed move G, was a corrective move after, followed by the bears continuing the down-leg.
An Example Trading Impulsive Moves
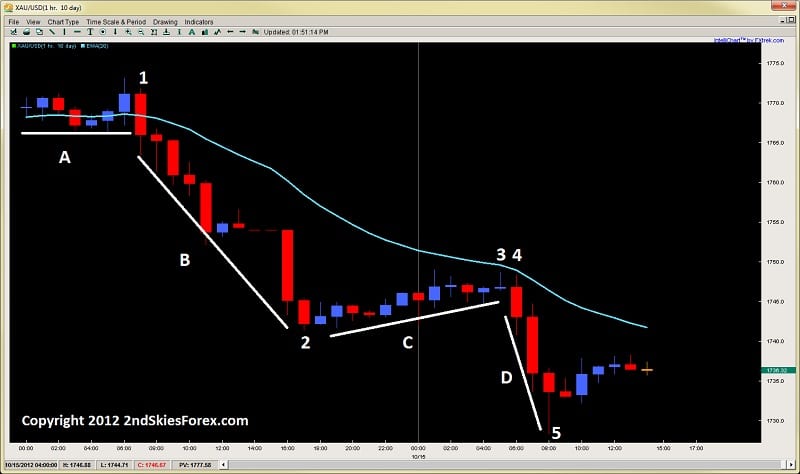
Today gave a really good example trading an impulsive move. Gold was a perfect example of a textbook impulsive-corrective series, offering a great setup to go short for a large reward to risk play.
Take a look at the chart below which is the 1hr chart on Gold. Starting with the top left of the chart, we can see a consolidation over line A which is a corrective move. Then at candle 1, we have more selling in one hour than total buying for the last seven, which starts an impulsive leg down at B, selling off about $25 in 10hrs.
At candle 2, we see a corrective move (C) whereby price climbs about $8 in 12hrs, so less than 1/3 the climb from move B which took more time. This is a clear example of how its less profitable to trade counter-trend than with trend. This is not to say we cannot trade counter-trend, but there is far less money to be made.
The corrective move at C ends with a pin bar rejection just $.50 below the 20ema, then starts another impulsive leg down at 4, dropping over $18 in 3hrs, also ending with a large pin bar. I actually bought off the lows and made a quick profit, but there was far more profit to be made in less time selling from 3 or 4, then buying off of 5.
In terms of knowing whether to buy or sell, if you can learn to find an impulsive move, followed by a weak corrective move, often times that corrective move will offer a pullback setup into the 20ema or a prior support/resistance level. These offer high probability low risk high reward setups. Anyone selling the pin bar rejection at 3, or the pullback into the 20ema at 4, with a tight stop above the 20ema, targeting either the low at 2, or waiting for the pin bar close at 5 would have made anywhere from a 3:1 reward to risk, up to 12:1 reward to risk.
These opportunities show up in the market all the time, and if you can learn to read them, you can make a considerable profit by trading with the institutions impulsive buying or selling. This is why it is critical to learn to read these moves, as they will help you not only trade in the right direction, but find highly profitable setups.
In Summary
This is just an introduction to how I approach price action and how I use this model as a base for understanding price action. When you can learn to read impulsive and corrective moves, you will find they are highly effective for many things, such as;
- finding the right direction
- staying in the trend
- spotting great pullback opportunities to get back in with trend
- knowing when the market will continue and when the market is likely to reverse
- how to find some of the more profitable moves in the market (impulsive)
- knowing who is in control of the market
and more…
There are many other facets and subtleties to trading impulsive and corrective price action, but this is a good introduction to my base theory and model for trading price action. If you can learn to spot the impulsive and corrective moves in the market, they can greatly enhance the odds of your trades along with helping you spot key characteristics in the markets.
To learn more about trading impulsive and corrective price action, visit the Trading Masterclass.


Hi Chris a small question. You speak of impulsive and of corrective moves. But sometimes I see in the daily chart a impulsive nove and in the 4hr chart a corrective nove.
Which is the right zone to adopt for opening a position?
Hello Fabrizio,
You have to understand multiple time frame context and how they relate to each other.
Kind Regards,
Chris
Excellent article Chris, and very easy to understand. I’ve noticed the presence of the 20Ema in most of the charts you posted. Does it served a purpose, since moving averages indicators are lagging, even exponential ones?
Great article. Thanks for the tutorial.
Glad you liked the article.
Kind Regards,
Chris
Hi Chris, this is truly a fantastic article, definitely opened a window, and I would like to open the door to PA. Kindly send me information on your course, as I’m very much interested to learn PA Strategy. My email is [email protected]
Hello Nouks,
Glad you liked the article and felt it changed the way you see price action.
RE: Price Action Course
You can visit the course page here (2ndskiesforex.com/advance-price-action-course/) which will give you all the information you need.
Any further questions, email me via the contact form on our website.
Kind Regards,
Chris
Hat’s off to you! Your explanations are fantastic. As a scientist, I really appreciate your quantitative approach to the variables, and seeing the pattern of 1-2 bars for what it is worth – next to nothing. By end of 2nd article I was able to spot potential entries. I only wish we could get aggregate order flow in FX, at the rate at which technology is progressing.
Hello PN Ranganathan,
Glad you liked the unique approach to price action and how 1-2 bar price action signals are worth very little.
But if you really learn to read PA, then you won’t need aggregate order flow to make good price action trades. Although it would help.
Kind Regards,
Chris Capre
I found this article very useful as I start to learn about price action. Thank you.
Hola BP,
Glad to hear as it’s a critical part of price action context and building your PA skills to read the market.
Kind Regards,
Chris
NEW CONCEPT ALERT! I’m not sure anyone else is teaching this. I hope I can slide these impulsive and corrective foundations under my current price action strategy. I think this may be the bedrock foundation I have been missing. Very excited to learn more. Thank you for making this publicly available.
Hello Steve,
Glad you’re finding the concepts and material here unique as it’s meant to be a basis for reading the order flow behind the price action.
So keep on with the study as it will pay dividends.
This is a great article explaining impulsive/corrective trends. Videos are great visual teachers but in conjunction with the written word they become even better. I like having a written explanation to compliment the video.
What’s the best way to get into a impulse move? Could you technically trade profitable with the impulse + corrective model including support and resistance levels?
Hello Tom,
These are the kinds of things we teach in the price action course, so hopefully you can join soon.
Kind Regards,
Chris Capre
Hi Chris,
Thanks for the great article. I found some good “meat” ( metaphorical of course ) here. If I keep reading your articles I’ll learn how to trade! If I actually practice this, I might even make a profit.
Best regards,
Tabb Mayo
Good to have you here Tabb and finding the price action material useful.
Kind Regards,
Chris Capre
Chris,
A terrific article that resonated with me on a number of levels.
As a past student of Niall Fuller, I can see I have a lot to “unlearn”
So glad I heard you on Hugh’s Trading Heroes podcast and bought
your course.
Reagrds Mike
Hola Mike,
Glad to hear this article resonated with you.
Yes, you definitely have a lot to unlearn, but the brain has neuroplasticity, so it can be done.
Good to be working with you.
Kind Regards,
Chris Capre
Great article. Very informative and easy to understand.
awesome Chris, it really added value in my current thoughts.
great stuff to read.
Hello Adden,
Glad you liked it – there is a lot more here.
Kind Regards,
Chris
Hello Chris
I think this one very short article has been more valuable
and insightful to me than the dozens of webinars and videos
I’ve watched over the last year! Amazingly I’ve heard no mention
of it from any other mentor
I look forward to enrolling in your price action course
Kind Regards
Mike King
Hello Mike,
I am glad you enjoyed this article as its a critical base model to how we approach price action. This model helps to build all the other models we use in the course
and thus read the market direction and order flow.
So am glad you are catching onto it as it means you are focusing on the right things.
Looking forward to working with you as well.
Kind Regards,
Chris Capre
Chris;
Great article. I am currently studying the Ichimoku Advanced series and found this as a link. This makes great sense and will help with entry and exit questions I believe.
Michael
great insight Chris. Thank you for sharing.
Hello Kamil,
Glad you enjoyed it and found it useful.
Kind Regards,
Chris Capre
Awesome. Very helpful ! Thanks Chris.
Nice Articles
I like your trading strategy.
Hello Mitul,
Glad you are enjoying the trading strategy and approach to price action.
Kind Regards,
Chris Capre
Hello Chris
This is the key to the door
I can honestly say doing your course was one of my best choices iv ever made
Anybody can learn these methods, you just have to put your mind to it
Thankyou for your support
Hello Dave,
Yes, this is one of the most important models to reading/trading price action, so glad you liked it and its been great having you on the course.
Kind Regards,
Chris Capre
Well, Chris, I was an extreme skeptic before I read these chapters. You have removed a lot of “brain fog” and “muddled thinking” about the FOREX Market. I don’t pretend to understand it all after one reading, but you make sense. Thanks! Keep up the good work.
Hello Tim,
Am glad you found this article useful in removing some brain fog. When you have the right models to understand the market, it will start to look clearer and things will start to make sense, so hopefully this is a first step.
Kind Regards,
Chris Capre
Thank you for writing this. I took other PA course because a friend of mine has already took it. But I have to wait, wait, wait, and I’m still waiting for the “perfect” set up and i’m not making any real money yet. I think I can see a real difference between both courses.
Can you add some highlight of your PA course besides “impulsive and correctives moves” please Chris!
God Bless
Hi Chris
Thanks for the guidance
really loved the article
thanks for sharing your knowledge
cheers
prem
Hello Premnath,
Am glad you liked it as its one of the most critical points to trading price action.
Kind Regards,
Chris Capre
Chris,
Thank you for the excellent article and chart examples on impulsive and corrective moves. This will help me to stay in trends longer than I typically do.
Best Regards,
Michael
Thanks Michael,
Yes, tis an important model to understand price action and order flow, so glad you liked it.
Kind Regards,
Chris
Hi,
Chris
thank you once again for sharing your knowledge and helping us understanding markets better day by day.
thanks a million
regards
rahulsinh (mumbai-india)
i loved the ” closes towards the highs/los move” point. serious knowledge you added to what i know. that will make me not to quit a trade tooo soon like i do often. thanks
It was really nice to read the whole well written article.
Hello Nomi,
Glad you liked the article.
Kind Regards,
Chris