One of the most difficult challenges for traders is finding forex entries and exits.
It’s an important question that needs to be answered and can determine if you are; 1. getting in at the correct location 2. can have your risk defined and as minimal as possible 3. have a clear location to take profit 4. and know how to protect the position If any of these are challenging for you, then you will want to learn how to use pivot points. Created by floor traders decades ago, they were used as a method to mark key levels of support and resistance. It started out with the daily pivot but morphed into other pivot levels the institutions are watching constantly on a daily basis. If I told you about 70-80% of all 1hr candles will touch a pivot level from the London open to the London close and sometimes even the NY close, would you pay attention to them? I’d hope so because price action’s constant contact with them suggests their potency as something that has to be respected. Before we go into examples of them on the charts, we will go over their basic construction.
All the pivots start with the composition of the DP or Daily Pivot. The DP is calculated by adding yesterday’s high, low and close, then dividing them all by 3.
The formula looks like this: DP = (H + L + C) /3 If you think about it, some of the most important pieces of data from a price action perspective are yesterday’s high, low and close. The high and low mark the extremes of price for that day (or how far the market was willing to go) and the close measures the acceptance of price at a particular level, along with how much strength in the buying or selling there was (determined by the closes’ position to the high or low). The remaining pivots are calculated by various multiples of the DP.
The formulas are below:
S1 = DP – (H – DP);
S2 = DP – (H – L);
S3 = L – (H – L);
R1 = DP + (DP – L);
R2 = DP + (H – L);
R3 = H + (H – L);
To briefly define them, the S1, S2 and S3 are what we call support pivots (S = Support) and the R1, R2 and R3 are what we call resistance pivots (R = Resistance). The S1 Pivot is the closest of the support pivots and the R1 the closest of the resistance pivots. The farther we go out (S2, S3, R2, R3) the further the pivots are from the DP.
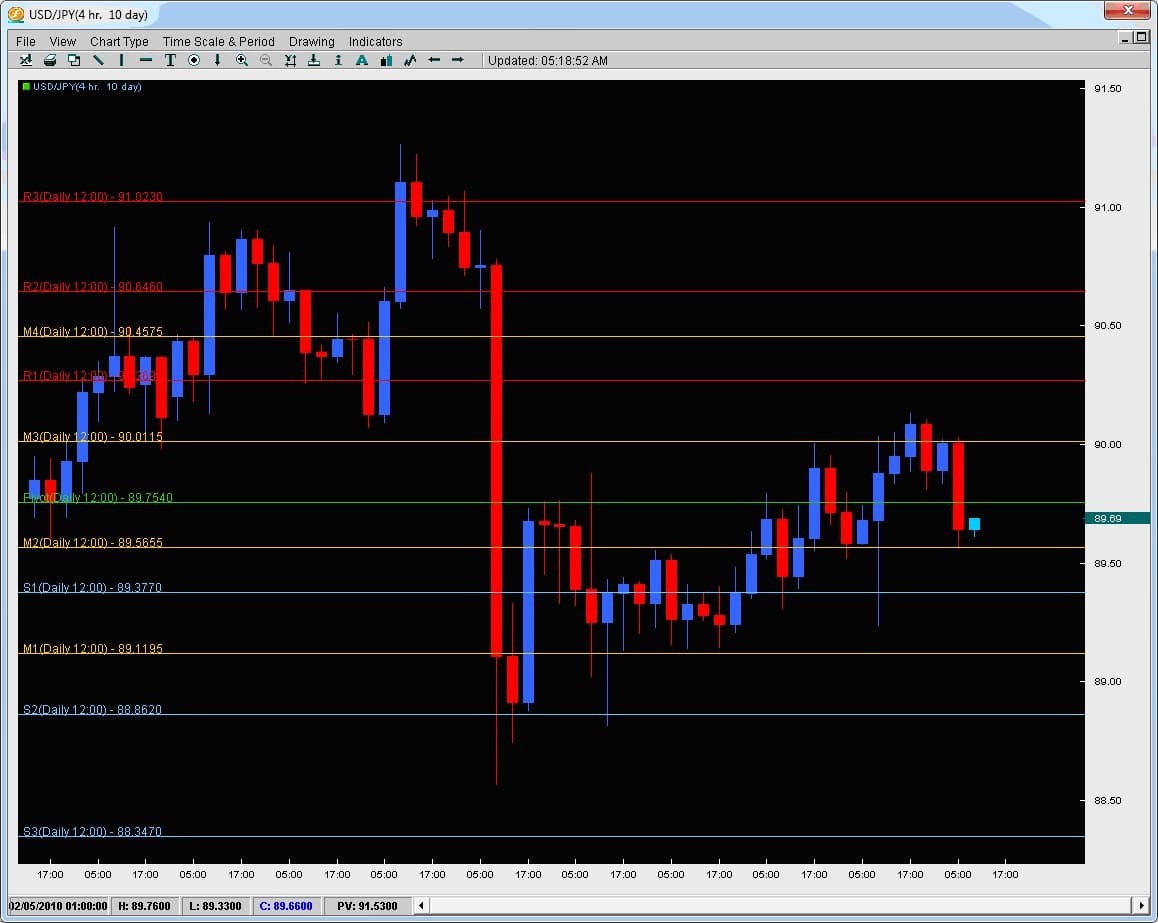
A chart below will show what they are and how they relate to price.
In this chart we are looking at the USDJPY on the 4hr time frame. The red lines are Resistance pivots and the blue lines are Support pivots. The yellow lines are Mid-Pivots and are simply the halfway point between any two pivots.
So how do Pivots help you with Entries and Exits?
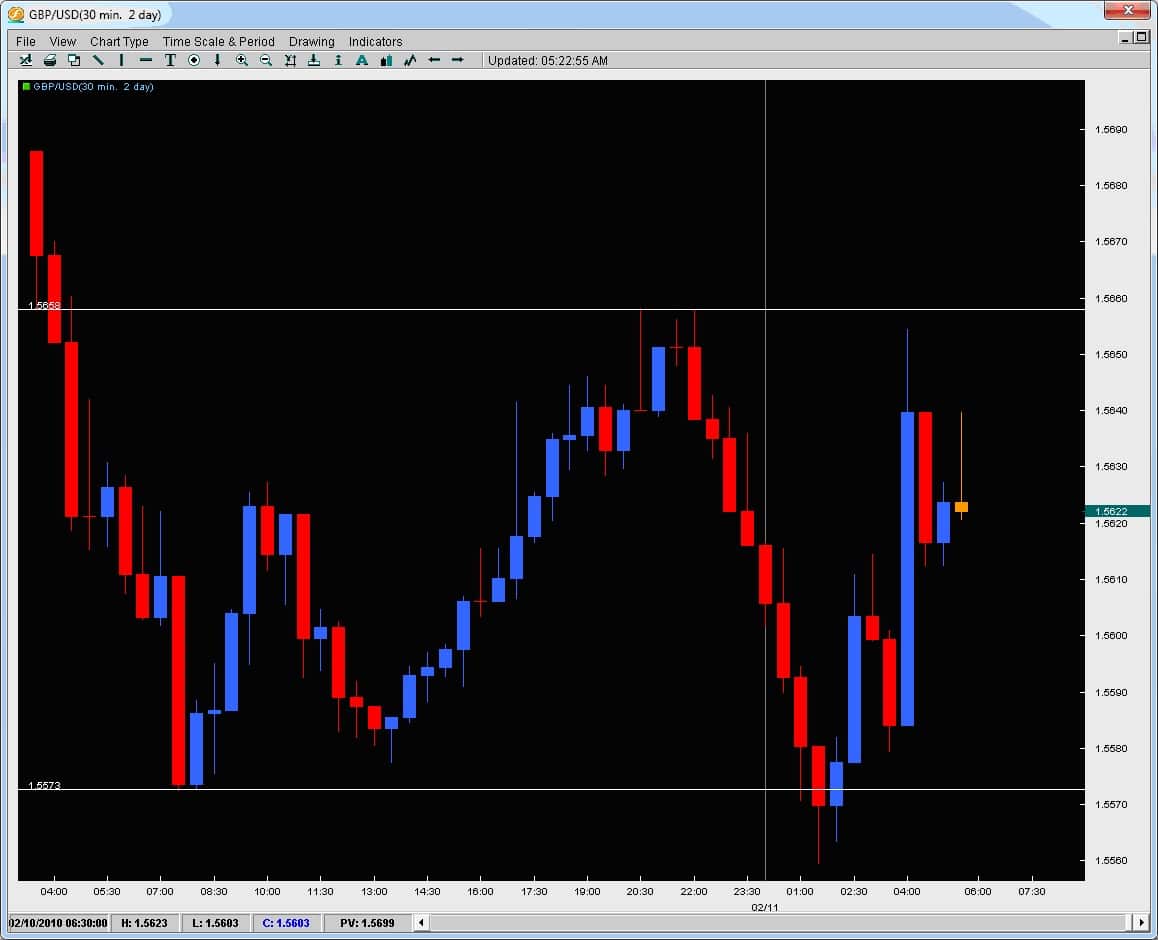
Simple. The institutions regard pivots as one of the most important things for placing intraday forex entries and exits. Price actions response to them confirms this but in regards to any other indicator out there, nothing has more contact with price action than pivot points (except a really short moving average which has little meaning to price at that point). There are actually statistics out there which show how price will make contact with pivots 70-80% of the time (on hourly chart). Lets take a look at the GBPUSD on the 30m chart below.
The grey line represents the London open (today Feb. 11th, 2010). We can see from the recent top why price today got rejected up around 1.5650/60 because of the last top there and price’s rejection at this level. But what about the bottom? The previous bottom was 1.5573 which the two candles to the left had touched but today, price went another 15pips past them. Why did the two candles today go past them and why did the market reject or react so sharply to those levels? Also, after bouncing off the bottom, price climbed to 1.5610 where two wicks to the topside formed and caused a small rejection. What was there to reject price in the past? This exact same rejection level became a support level once price had broken it.
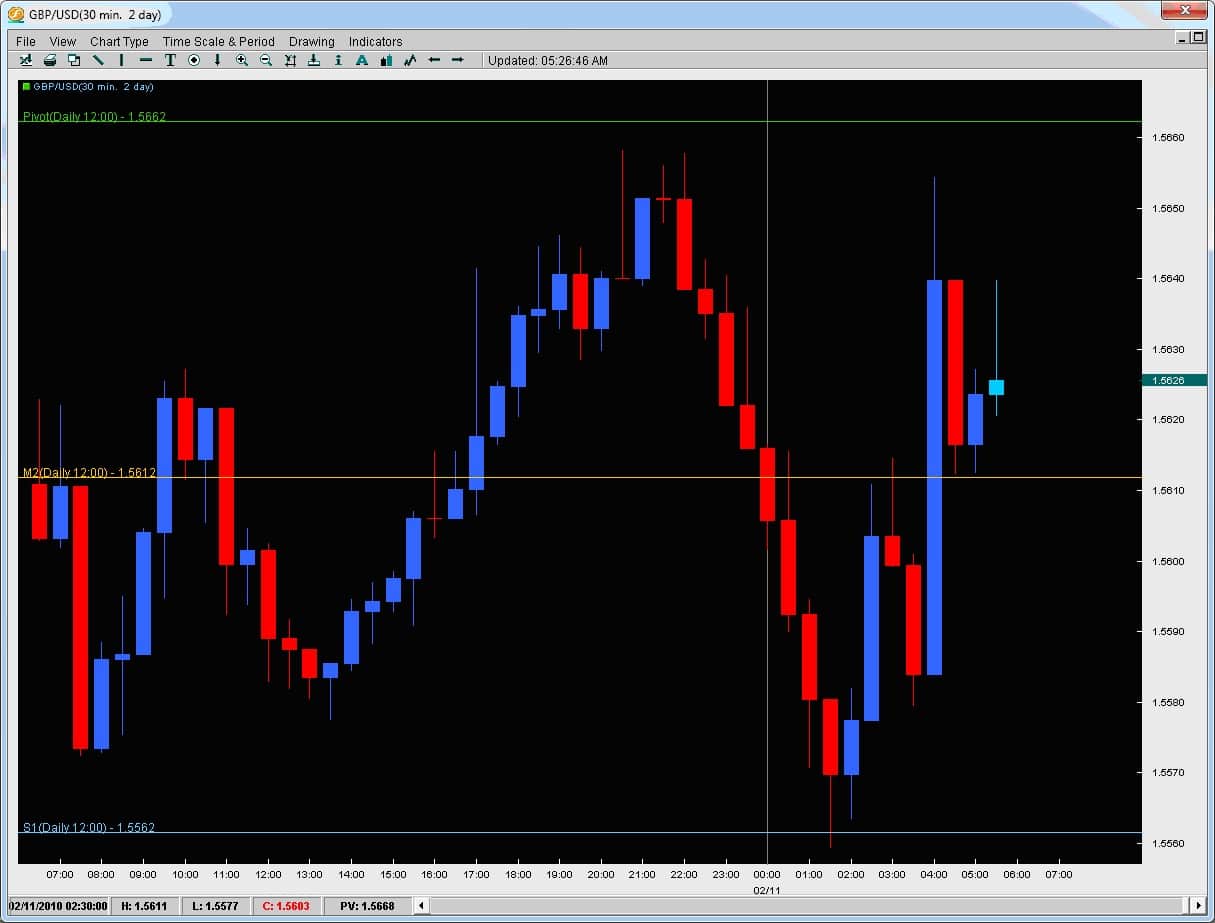
Take a look at the chart below and you will have the answer why.
As you can see, price went past the previous support level and touched the S1 (Support 1 Pivot). Treated it as support for two candles, then rejected off of it.
Where did it go to?
The M2 Pivot (Mid2 Pivot) and rejected twice off there. Once price broke this level, it then came back to do what? Treat the Mid-2 Pivot as support. These types of reactions/responses from the market occur all the time on an intraday basis. They give the trader a much more precise level to enter the market for intraday trading while also giving us ideas for precise exits. If you would like to learn how to use them for precise forex entries and exits for your intraday trading, learn what the % chance price will break any given pivot on any given day, learn what the % chance price will touch the next pivot after breaking one pivot, or how to spot key reversal and breakout strategies using pivots, then check out the Price Action and Pivot Point Course.

