One of the more crucial lessons in my price action course is called ‘The 10 Key Tips For Trading Support & Resistance Levels You Must Know‘.
In today’s article I’m going to share two forex support and resistance trading tips from the course lesson which can have a massive impact on your trading and understanding of price action.
The first one will focus on the price action context around key support and resistance levels between higher TFs (time frames) and intra-day TF’s.
For the record, I view the higher TFs as the daily and 4hr chart while the lower TFs to be between the 1hr and 5m charts.
The second key point around trading support and resistance covers the order flow and price action around high probability trades.
Intra-day Price Action Context Can/Often Will Contradict Higher Time Frame Context
Because of the higher time frame myth narrative (which states the only way to trade price action is via the higher TFs), those following this narrative have neglected a key part of price action. That is learning to understand and read intra-day price action.
Because of this, traders have treated anything in the lower time frames as ‘noise‘ which is a false understanding of price action and time frames.
Lower time frames are just a different lens into price action and sometimes can offer a more nuanced understanding of the order flow behind the PA.
This has led to many traders not understanding that intra-day price action can and often will have it’s own context. This is a problem because we have to understand how the intra-day PA may affect or inform our trades for that day.
What it also translates into is intra-day price action context can and often will contradict the higher TF context.
Hence if we are trading with the intra-day context, but against the higher TF context, our holding times by default should be shorter and we should be anticipating (or be prepared) to exit quicker.
I’d like to share a good example of this principle with the USDJPY which has been in a large 550 pip range since the end of last year.
USDJPY Daily Chart
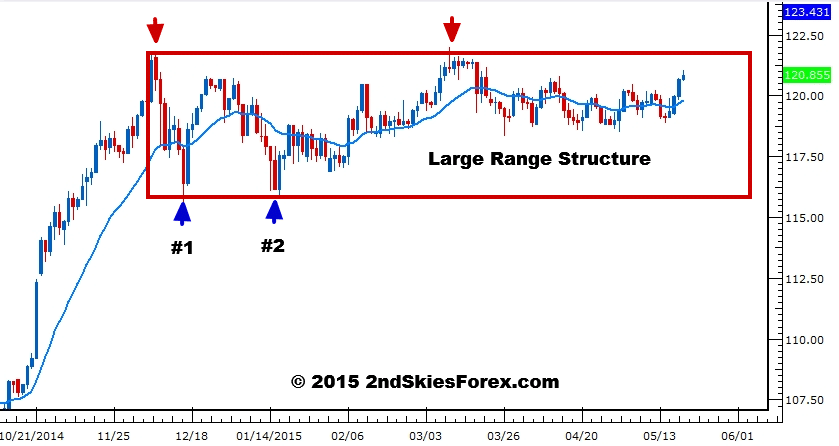
What you are seeing above is the USDJPY daily chart.
After a large bull run from 107.50, the pair entered a corrective phase forming a large range near the highs between 115.75 and 121.15.
You’ll see the range marked by the red box and the first two pullbacks into support (#’s 1 and 2) which were around Dec. 16th and Jan. 15th.
In the next chart, you’ll see the intra-day price action context on Dec. 16th via the 1hr chart.
USDJPY 1hr Chart
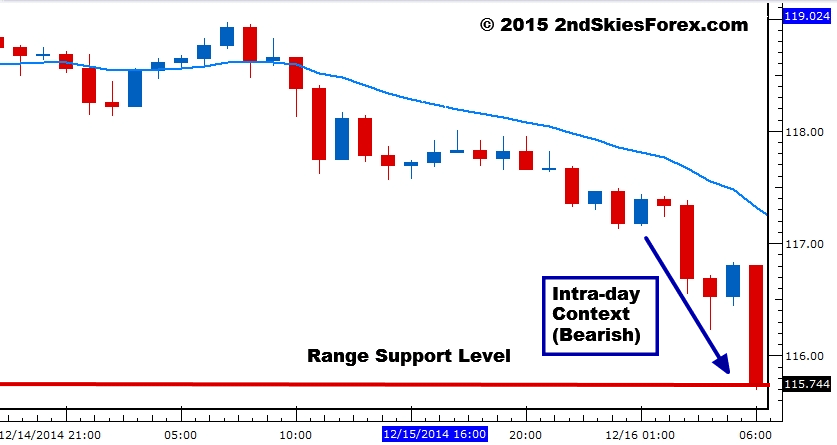
Notice how the intra-day price action context is completely different from the higher TF context?
By not segregating the two types of context (intra-day and higher) we can often get scared out of these trades as they run into our key levels impulsively.
Many times I hear struggling traders email me how they had a trade setup to buy or sell at a particular level and trade location.
Yet because they were watching the intra-day price action context only, they abandoned the trade.
However right after you let the trade go and canceled it for fear of getting stopped out, the market touches there entry location, bounces right off of it and runs straight to your target.
A great example of this is the USDJPY pair on Dec. 16th (see below)
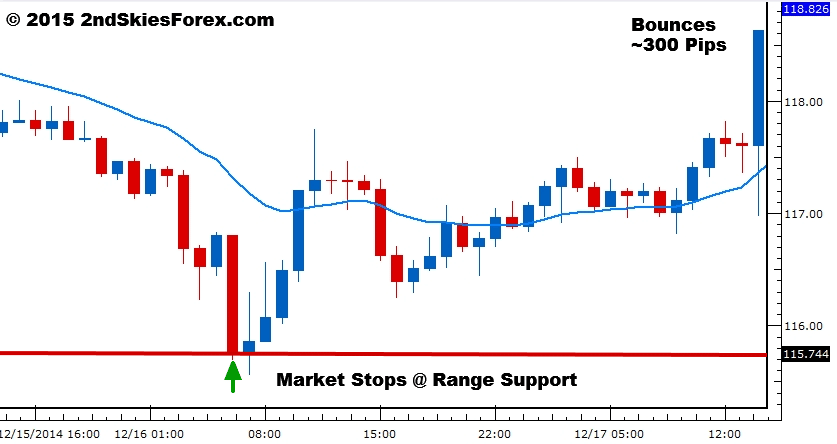
Hours later after not taking the trade, you are wondering why you abandoned your trade plan and missed out on a perfectly good trade.
Has this ever happened to you?
It’s certainly happened to me, and likely all of us at one point.
The key point here is it’s important to understand intra-day price action context can and will contradict the higher TF context.
This DOES NOT mean we abandon the lower TF context for the higher one. We have to understand it is information and can often add to our trade ideas.
But ignoring it and focusing on the higher TFs only is not the approach as this leaves you lacking a key skill – learning to understand and read intra-day price action.
And this skill will be of great value to you in locking in high +R trades when learning to manage them.
Impulsive Rejections & Short Holding Times At a Key Level are a Positive Confluence Factor
This one is important to understand regarding the order flow and PA around (and off) a key level.
Many times the PA will just consolidate around a level before making a move (to hold or break). There are plenty of price action clues we can learn to read which will intimate the more likely scenario.
But anytime you see a very large reaction off your trade location around a key support or resistance level, it usually indicates a positive confluence factor to your trade.
Why?
Because the sharp bounce more often is caused by large institutional players holding/defending a key level with strength.
Being able to reverse the move into a key level takes size and volume, and pushing back with vigor indicates the ability to absorb the pressuring heading into the level (often called ‘absorption’).
By creating a heavy imbalance between the buyers and sellers, this further reduces the counter-move interest and shows the order books are likely heavily stacked to one side which further supports your trade idea and location.
Also the fact the PA spent little time at a level indicates the speed of the buying interest from the institutional side which is also highly supportive for your trade.
The key take home point from this is to a) be able to observe and read the price action and reaction off the level to get an insight into the order flow around the level, and b) understand this impulsive bounce likely indicates a high profit potential trade.
An example of this is in the chart below on a live trade setup for the EURUSD we profited from heavily and I traded with my own money (really can’t believe I have to keep saying this as I’m only always trading with my own money).
EURUSD Live Trade
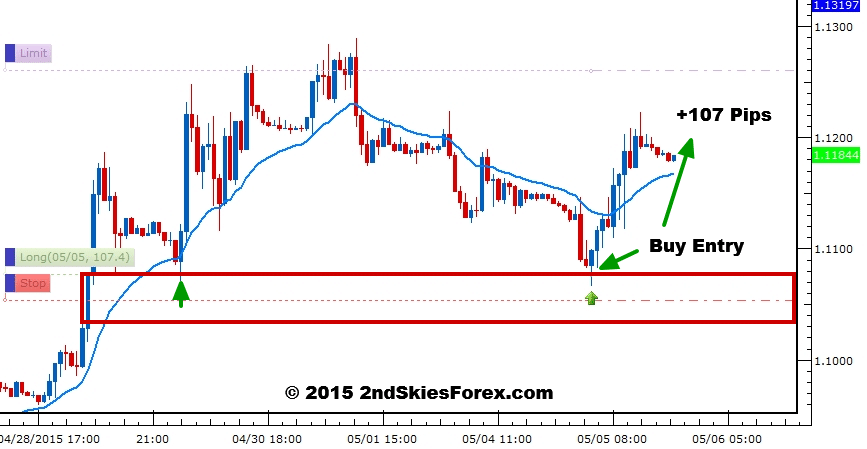
Looking at the chart above, you are seeing a screenshot of when I was in the trade, showing my entry trade location (1.1075), my SL at 1.1050 and my TP and 1.1250/60.
This trade ended up hitting it’s target, but notice how the pair bounced off the support level quickly forming a pin bar rejection in the process.
NOTE: If you were trading the illusory pin bar 50% retrace tweak entry, you would have gotten a much worse entry location vs. mine.
It is important to understand why confirmation in price action is an illusion and how it hurts your profits.
Regardless, the nice tail rejection + closing on the top of the bar indicates strong buying off my entry location.
The fact the next two bars also repeated the same meant a) my trade almost never went in the negative, and b) the strong impulsive reaction off the level indicates a high +R potential trade.
And that is exactly what happened profiting +186 pips on a roughly 25 pip stop for a +7.5R trade.
How often do you get those trading your daily pin bars?
In Review
Ignoring the intra-day price action context will leave you with a weakened skill level and ability to understand the overall price action context. Yes, intra-day context can and often will contradict the higher TF context, but this does not mean we ignore them.
It is simply ‘information‘ and can be highly informative for us when either trading intra-day, with trend, or counter-trend.
The information can also be informative to us about our trade when you learn to read the subtle price action clues before, and at the level.
Also we have to be aware of highly impulsive reactions off a key level as that could indicate a larger profit potential for our trade.
You may have a typical +2R profit target for your trade, but a highly impulsive and quick reaction (or short holding time) at your trade location may indicate there is a larger move in play (and thus more profit potential).
With that being said, what tips do you use to help trade price action around key support and resistance levels?
Please share, like and tweet these forex support and resistance trading tips along with sharing it on any forums or with anyone you think can benefit.


wow! Chris you are indeed a blessing, I love this article
Hello Toju – glad you are liking the free articles and videos here on price action
Hi Chris,
Another good tips…thanks. My entry point is almost the same as you indicate, except I like to use the psychological level like prices ending with 50’s or 00’s. I use the 4h chart to confirm my entry point…I usually look for s/r level that coincide with the Bollinger upper/lower bands. This mean I only short from BB upper band and buy from BB lower band and I never do the opposite. Buying at the BB upper band or selling at the BB lower band is a big mistake, especially also at the s/r level. Beside trading at the s/r level that coincide with Bollinger upper/lower bands, I also like to trade from the trend channel lines…i call this area a “hot spot”…where s/r level + Bollinger Bands + trend channel meet a one point….
Any comment and feed back appreciated….
Hi Chris, I appreaciate your articles. Your thoughts are a bright light! But here on this one a short question. At 12/16/14 the USDJPY reached the 115.75 level and you labeled this as range support. But at his moment this wasn´t a range support. The lower boundary of this range was first formed at this date. Isn´t so? All the context is right if you would descripte the intraday PA a month later at the 01/16/15. Maybe just a slip… Keep it up!
Hola Marcus,
Thanks for the positive comments as I take great pride in my work.
RE: Context/Range
Hmmm, I think there is a mis-understanding here, but based on how it’s written, I can see why this would happen.
First off the red box is just the range, we didn’t say it was defined by the first touch on Dec. 16th. We just noted the first two touches which formed the bottom.
Second, the first impulsive pullback in a large bull trend doesn’t change the higher TF context. Literally on the Dec. 16th commentary for our members, we talked about being only bullish while above 115.50 support. Why? Because the higher TF context was still bullish in our eyes while the intra-day was bearish until the close.
On Jan 14th in the members commentary, we talked about buying around 116 (before the 2nd touch and range bottom had formed).
Why? Because again – in our eyes (and as we suggested to members) the context was still bullish while the intra-day was bearish, so no real contradiction here.
Regardless, I can see the mis-understanding and why one would come to that sentiment.
Kind Regards,
Chris Capre
I want to trade for a living.
Hello Chak,
You are welcome to become a member and start training to do what you want for a living.
Kind Regards,
Chris Capre
I have always wandered who are those brave and mighty who make the price turn…now I know the answer!
Hola Alexander,
Institutions my Russian friend – the institutions (hedge funds, banks, etc) are the ones making the statement and standing by it with their money.
Kind Regards,
Chris Capre